
Oh, the places they'll go: Where college-educated workers land



Where does a state’s talent come from?
Usually, it follows one of four paths.
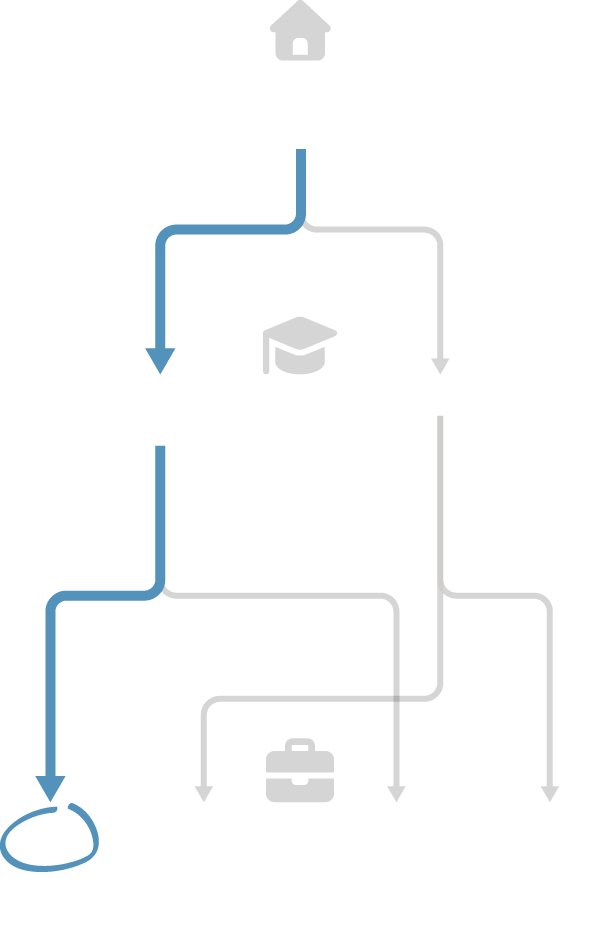
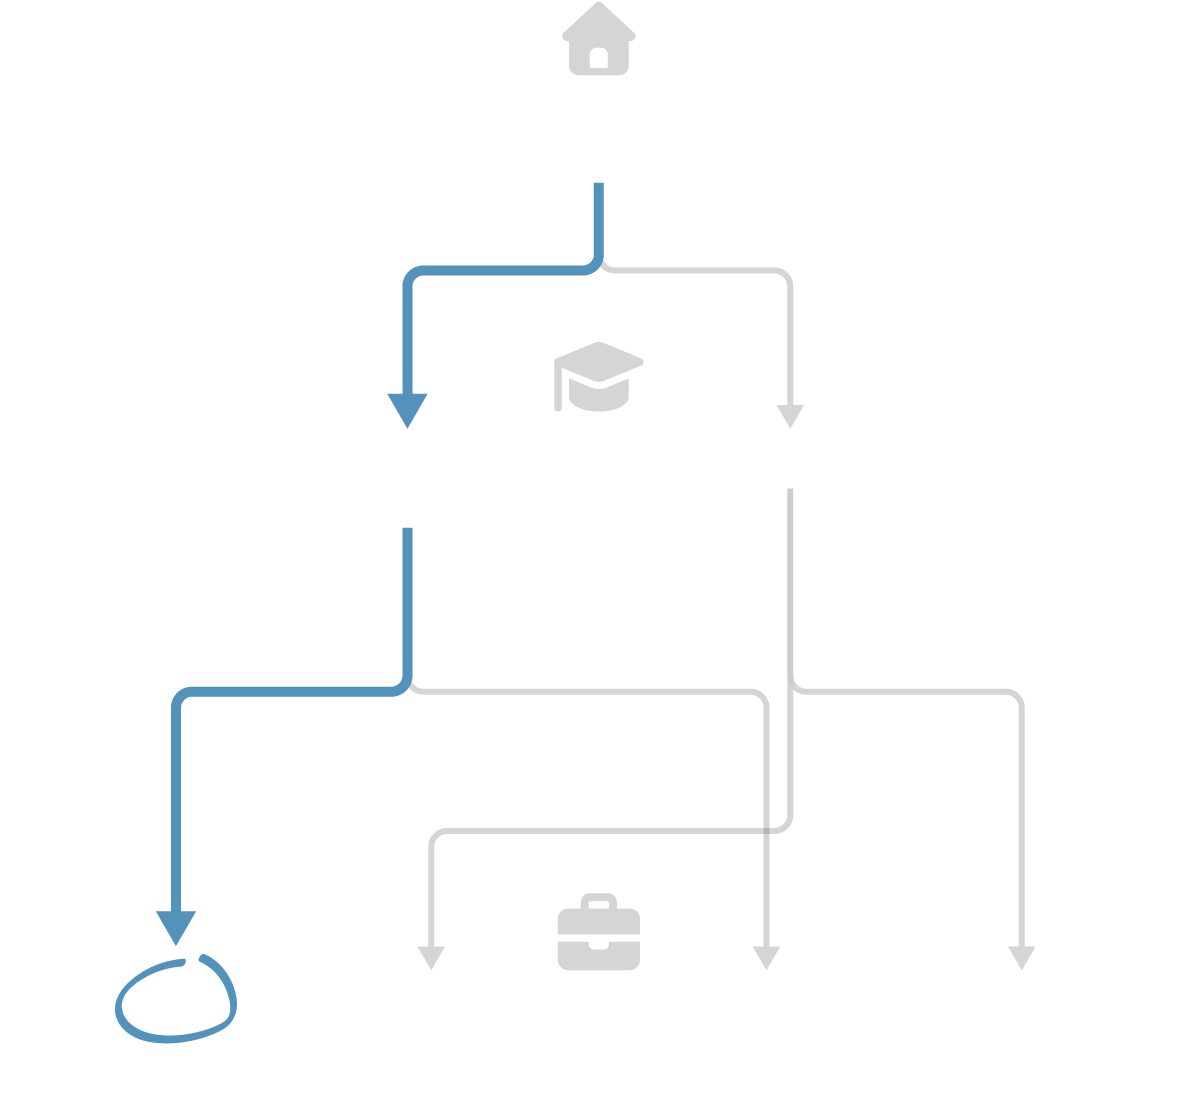
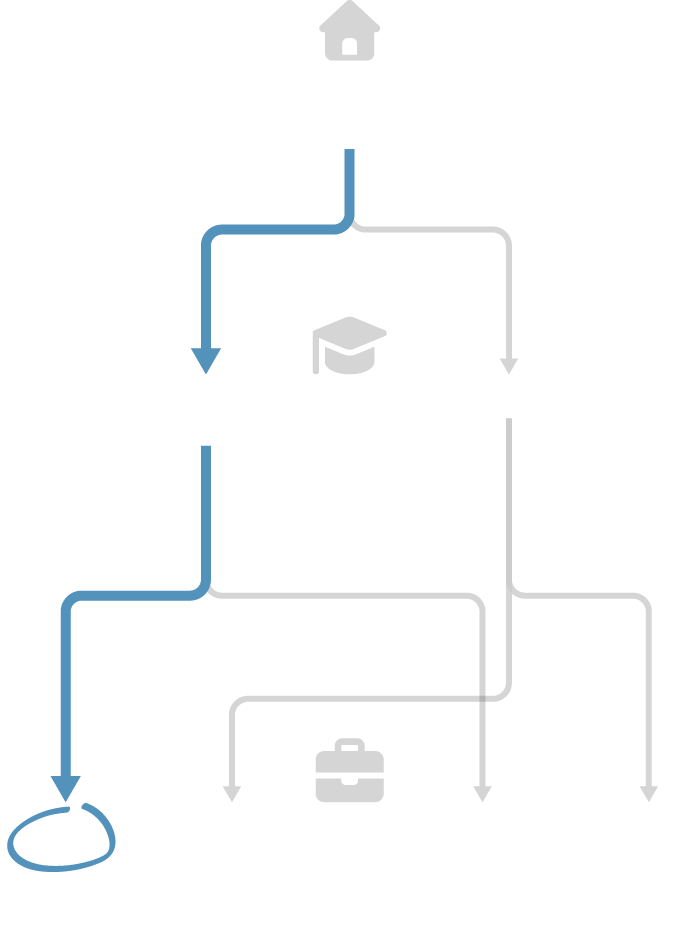
Nationally, 55 percent of college-educated talent is homegrown — individuals who work in the state where they both attended high school and earned their bachelor’s or graduate degree.
Homegrown talent
graduates high school ...
... goes to college
in their home state ...
Out-of-state
55%
24%
9%
12%
Out-of-state
... and works in
their home state.
Homegrown talent
graduates high school ...
... goes to college
in their home state ...
Out-of-state
55%
12%
24%
9%
... and works in
their home state.
Out-of-state
Homegrown talent
graduates high school ...
... goes to college
in their home state ...
Out-of-state
55%
12%
24%
9%
Out-of-state
... and works in
their home state.

Note: Students who went to college in state and work out of state may have attended both high school and college in the same state or attended high school in one state and college in another.
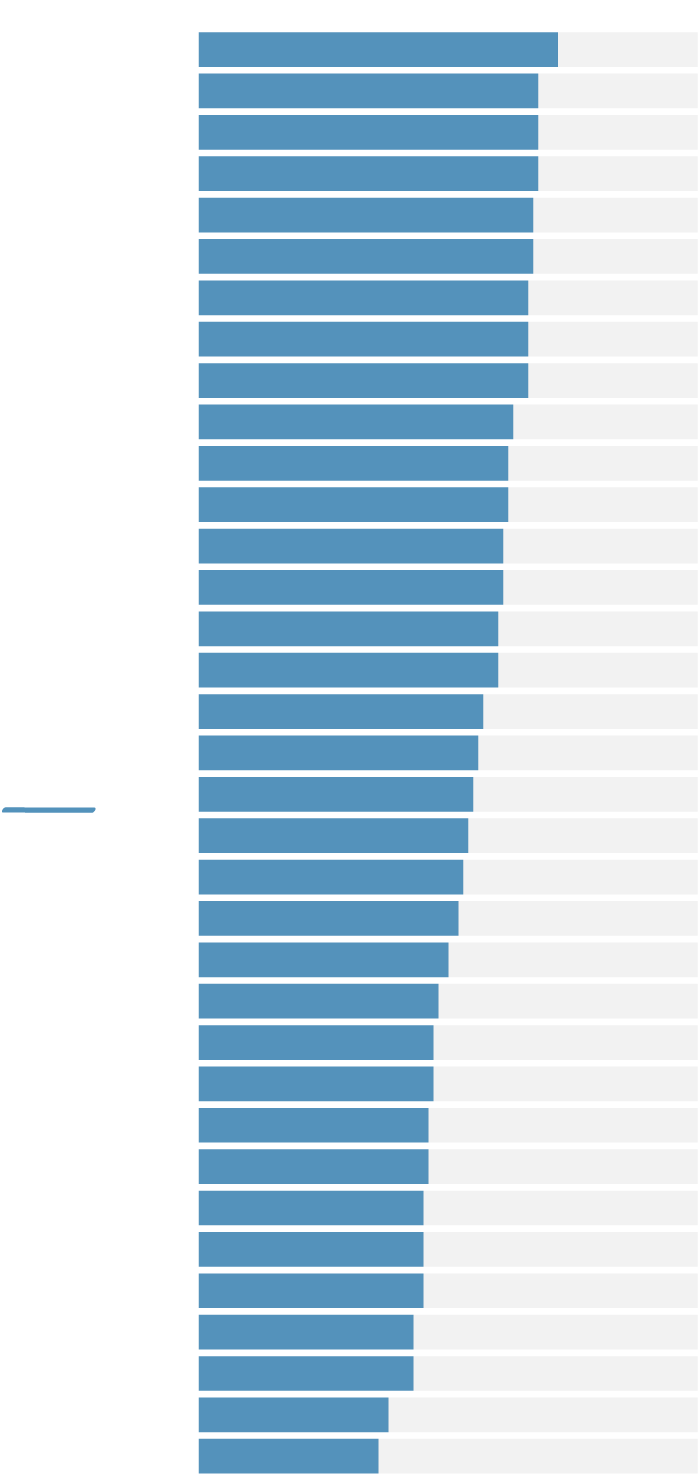
The landscape of homegrown talent varies substantially by state.
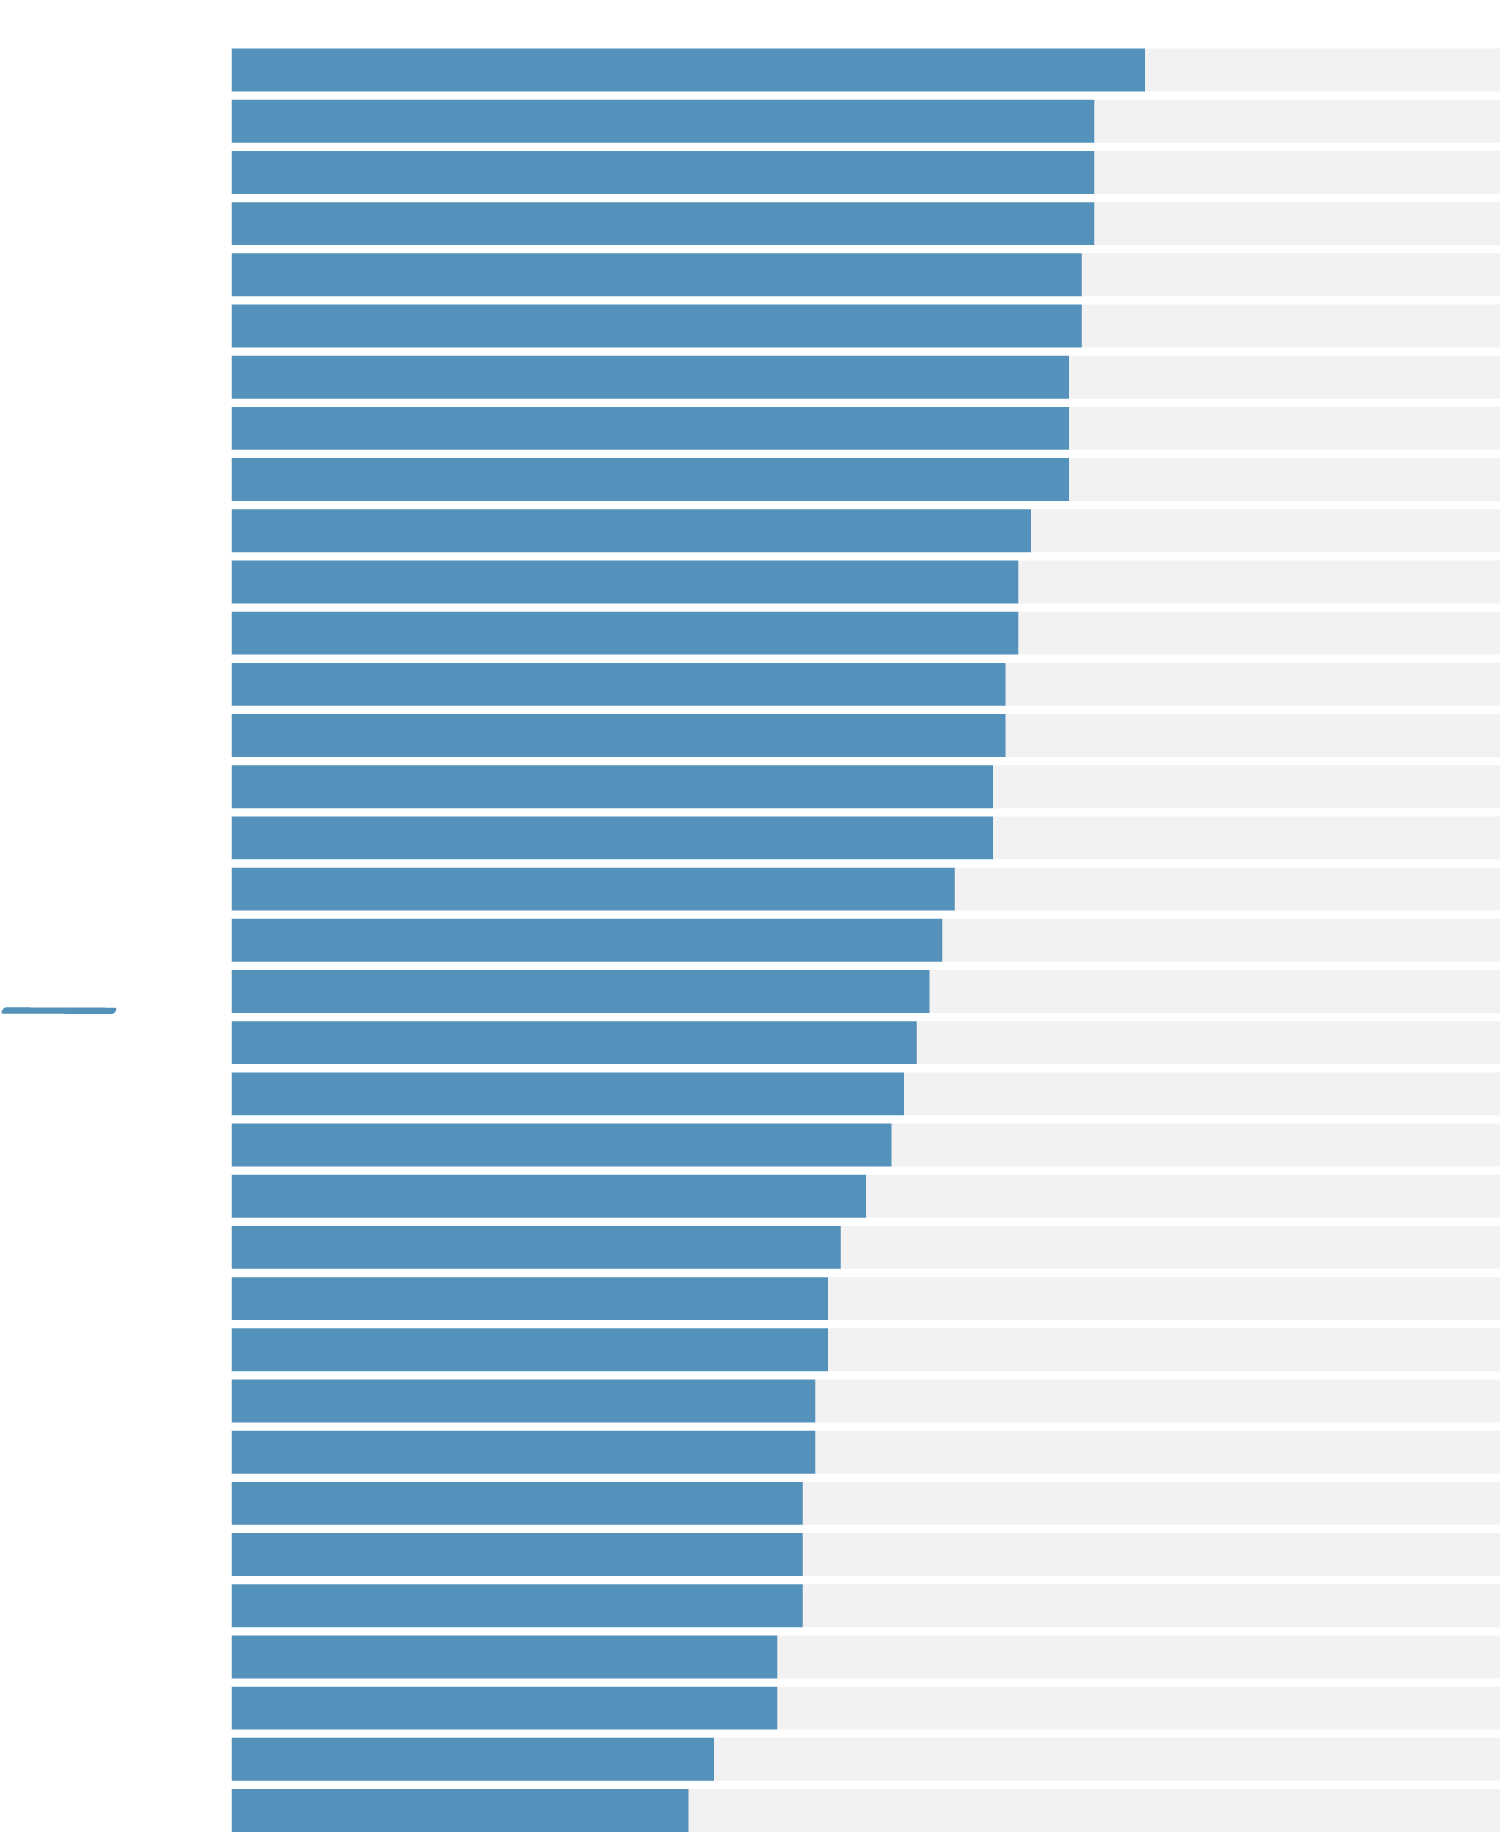
Homegrown
Other
Michigan
72%
Oklahoma
68
Ohio
68
Alabama
68
Louisiana
67
California
67
Nebraska
66
Kentucky
66
Arkansas
66
Iowa
63
Indiana
62
Missouri
62
Pennsylvania
61
Texas
61
Wisconsin
60
New York
60
Tennessee
57
Illinois
56
National
55
Utah
54
North Carolina
53
Minnesota
52
Florida
50
Connecticut
48
Massachusetts
47
South Carolina
47
Virginia
46
Washington
46
New Jersey
45
Georgia
45
Kansas
45
Arizona
43
Oregon
43
Maryland
38
Colorado
36
Homegrown
Other
72%
Michigan
68
Oklahoma
68
Ohio
68
Alabama
67
Louisiana
67
California
66
Nebraska
66
Kentucky
66
Arkansas
63
Iowa
62
Indiana
62
Missouri
61
Pennsylvania
61
Texas
60
Wisconsin
60
New York
57
Tennessee
56
Illinois
National
55
54
Utah
53
North Carolina
52
Minnesota
50
Florida
48
Connecticut
47
Massachusetts
47
South Carolina
46
Virginia
46
Washington
45
New Jersey
45
Georgia
45
Kansas
43
Arizona
43
Oregon
38
Maryland
36
Colorado

Note: Certain states were excluded due to small sample sizes within the college-educated population.
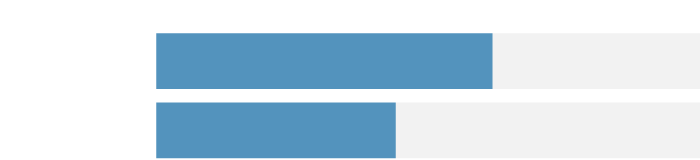
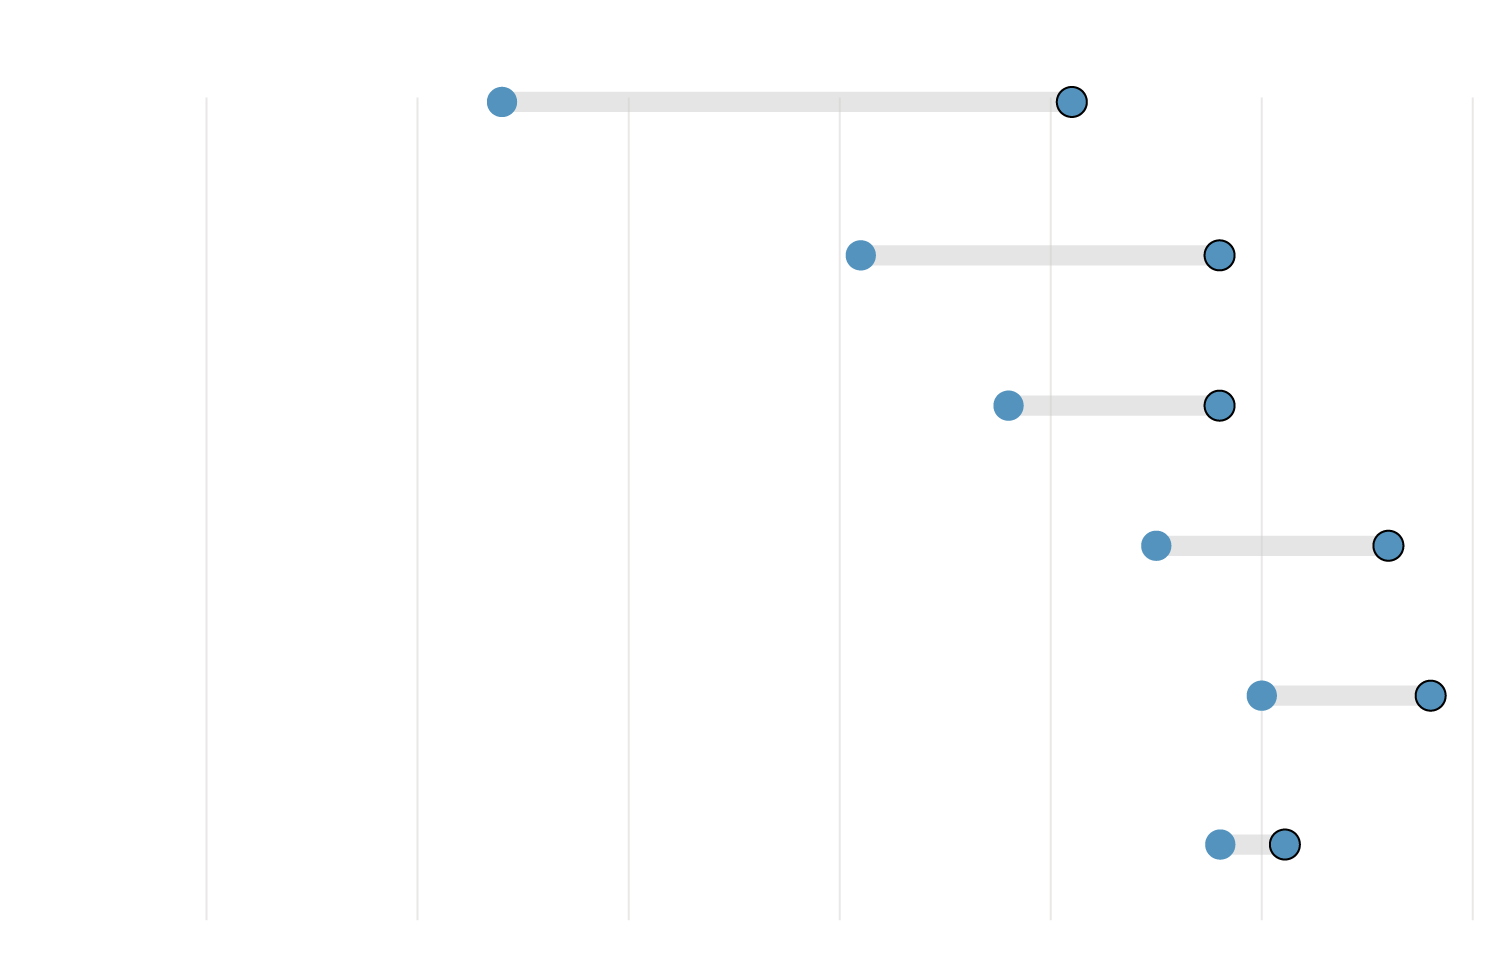
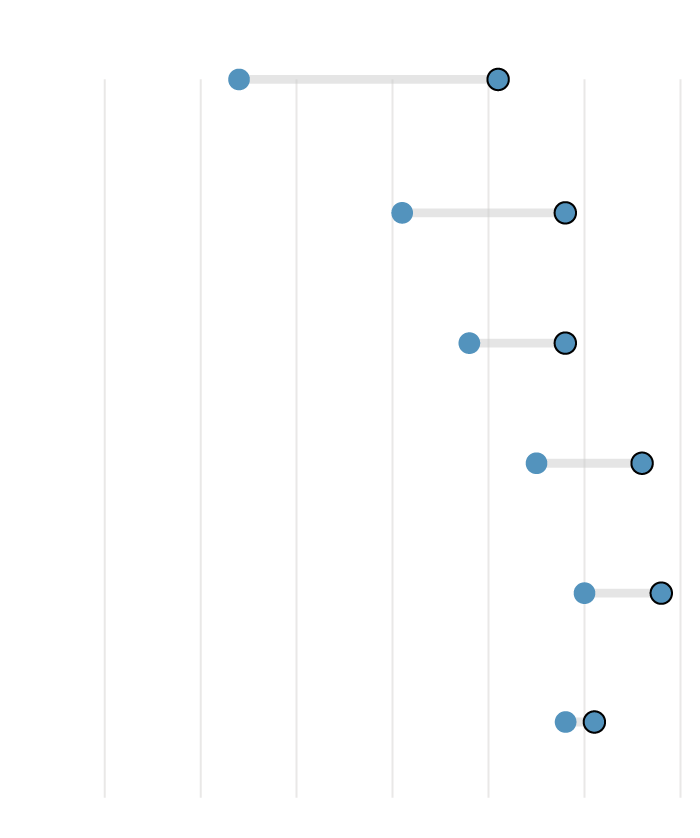
Nationally, public colleges and universities are anchors for homegrown talent …

Homegrown
Other
62%
Public
Private
nonprofit
44

Homegrown
Other
62%
Public
44
Private nonprofit
Homegrown
Other
62%
Public
Private
nonprofit
44

... even at the most competitive tier.
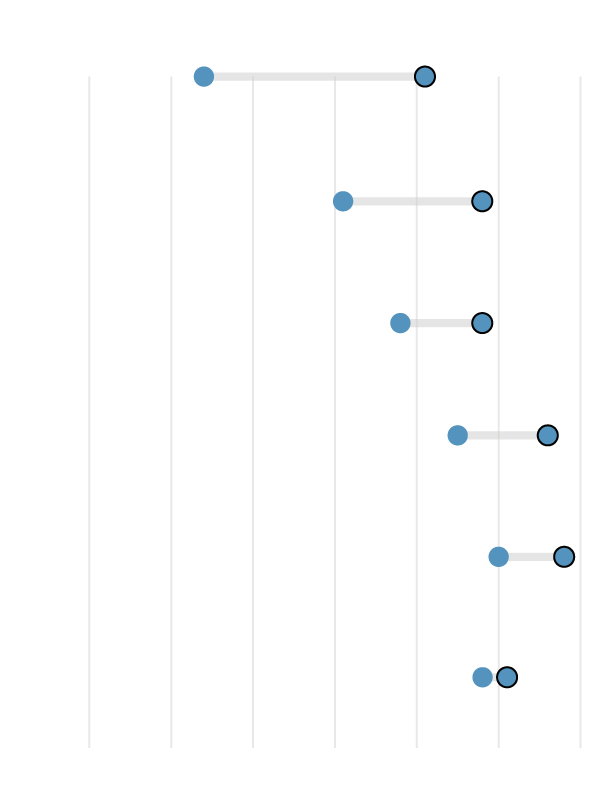
Private
nonprofit
Public
Most
competitive
24%
51%
homegrown
talent
Highly
competitive
41
58
Very
competitive
48
58
Competitive
55
66
Less competitive
60
68
Noncompetitive
58
61
10%
20
30
40
50
60
70
Private
nonprofit
Public
Most competitive
24%
51%
homegrown
talent
Highly competitive
41
58
Very competitive
48
58
Competitive
55
66
Less competitive
60
68
Noncompetitive
58
61
10%
20
30
40
50
60
70
Private
nonprofit
Public
Most
competitive
24%
51%
homegrown
talent
Highly
competitive
41
58
Very
competitive
48
58
Competitive
55
66
Less competitive
60
68
Noncompetitive
58
61
10%
20
30
40
50
60
70

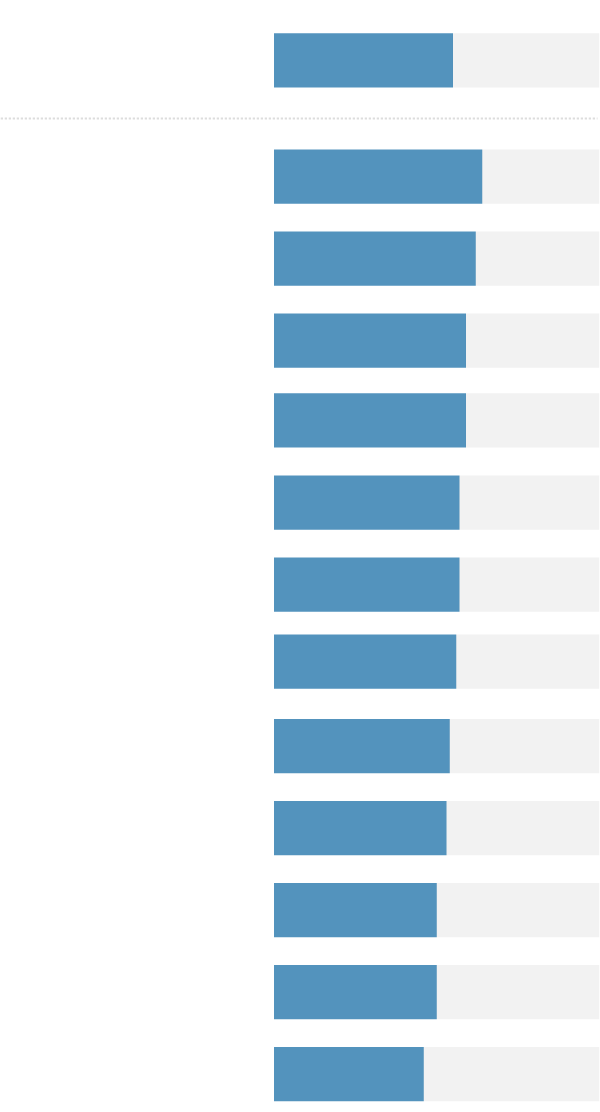
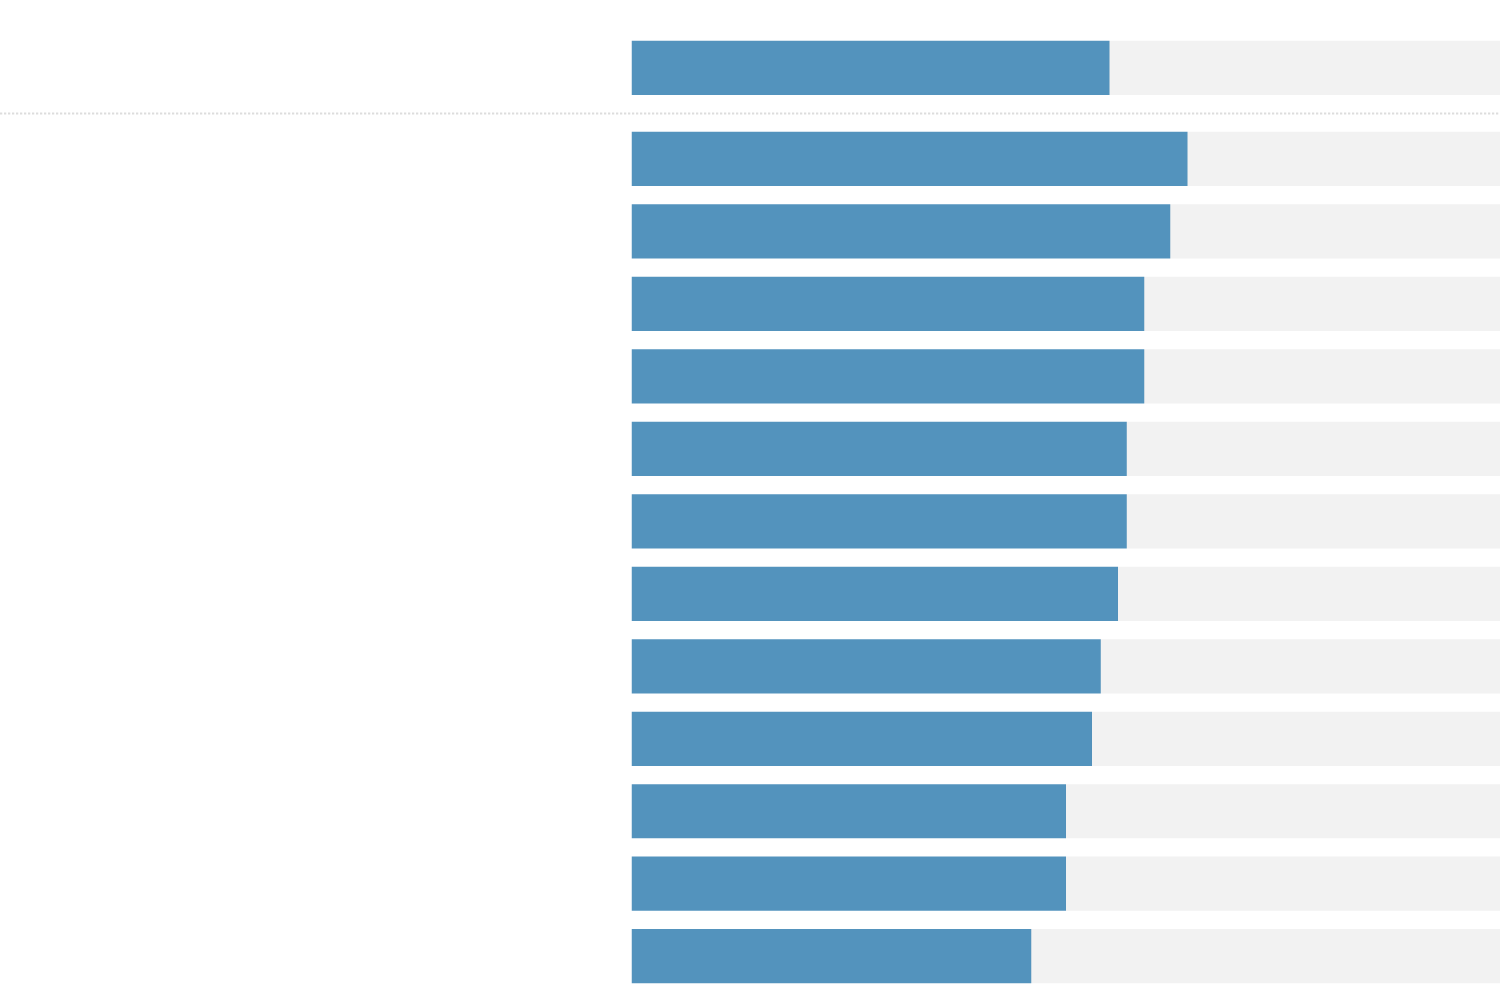
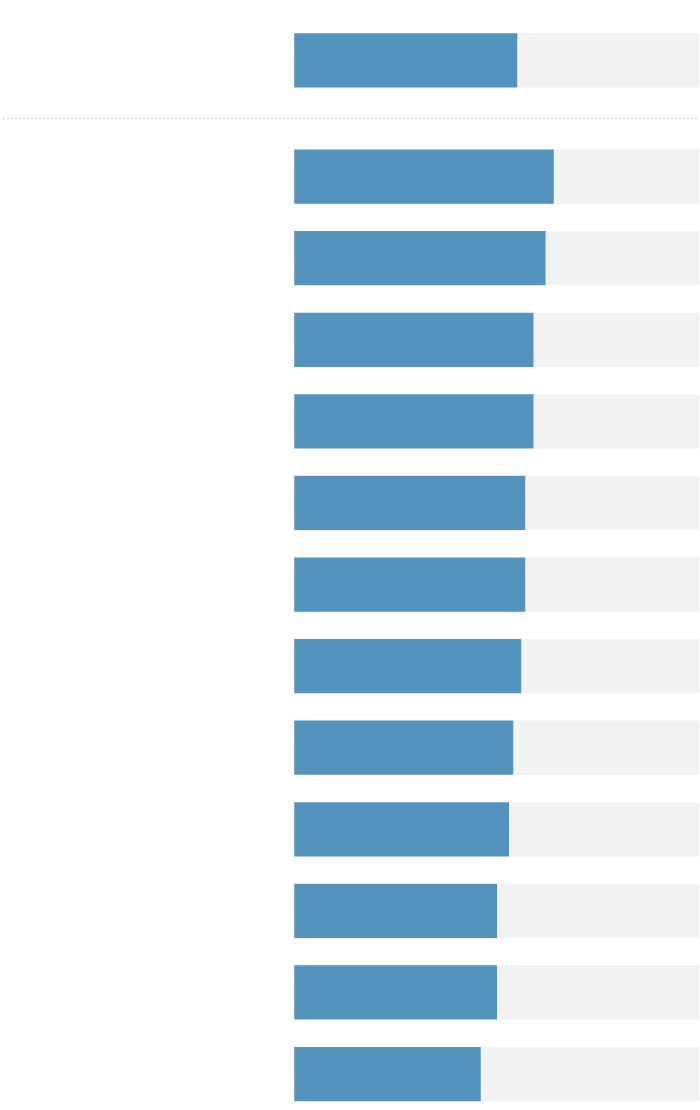
Migration patterns vary by career field, with specific occupations and their corresponding academic majors following similar trends. Those in the arts are least likely to work in the state where they attended college and high school.
Homegrown
Other
55%
All occupations
Personal and human
services
64
62
Trade and technical
59
Small business owner
Education, training,
and library
59
Business and
administrative
57
Life, physical, and
social sciences
57
Law, public services,
and safety
56
Managers, executives,
and officials
54
53
Healthcare
Engineering and
architecture
50
Mathematics and
computers
50
Arts, design,
entertainment,
and media
46
Homegrown
Other
All occupations
55%
Personal and human services
64
Trade and technical
62
Small business owner
59
Education, training, and library
59
Business and administrative
57
Life, physical, and social sciences
57
Law, public services, and safety
56
Managers, executives, and officials
54
Healthcare
53
Engineering and architecture
50
Mathematics and computers
50
Arts, design,
entertainment, and media
46
Homegrown
Other
55%
All occupations
Personal and human
services
64
Trade and technical
62
Small business owner
59
Education, training,
and library
59
Business and
administrative
57
Life, physical, and
social sciences
57
Law, public services,
and safety
56
Managers, executives,
and officials
54
Healthcare
53
Engineering and
architecture
50
Mathematics and
computers
50
Arts, design,
entertainment,
and media
46

Homegrown graduates are less likely to hold advanced degrees and more likely to be first-generation students than those who relocate for work.
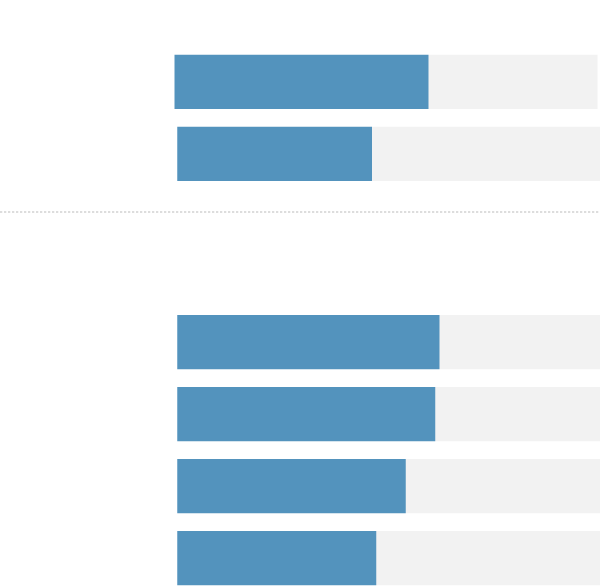
Highest degree
60% Homegrown
Bachelor’s
46
Graduate
Parent’s education level
High school
or below
62%
Some college
or associates
61
54
Bachelor’s
47
Graduate
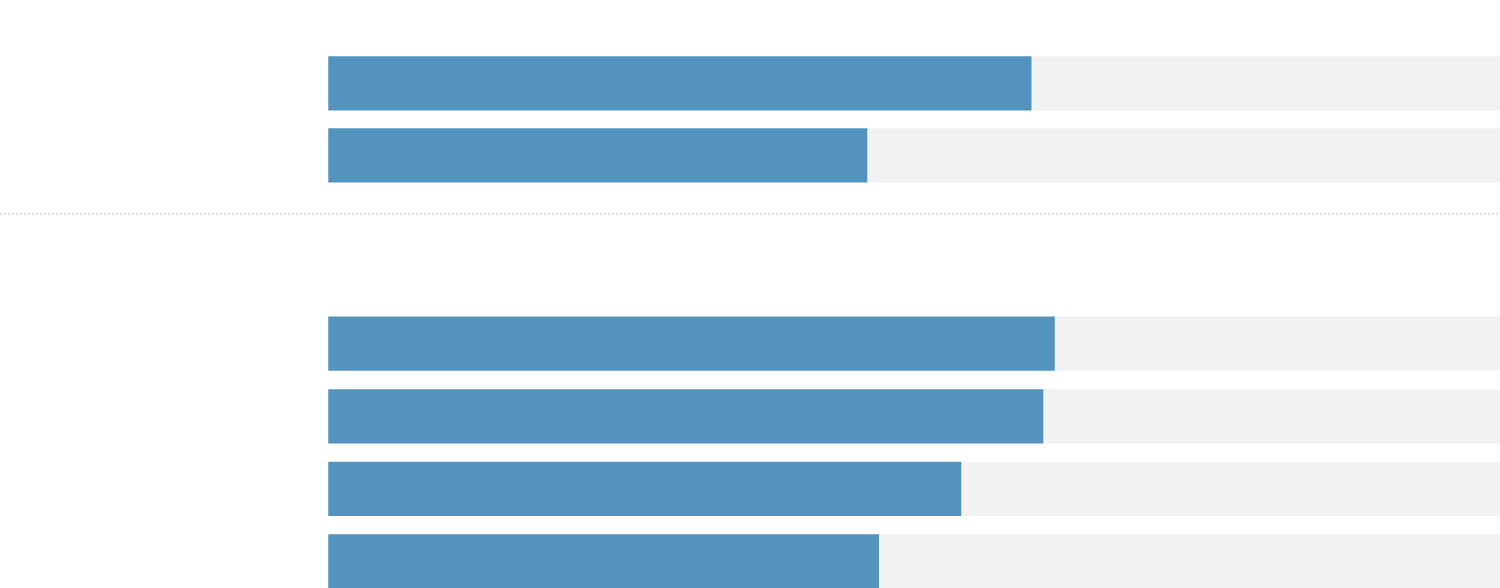
Highest degree
60% Homegrown
Bachelor’s
Graduate
46
Parent’s education level
62%
High school or below
Some college
or associates
61
54
Bachelor’s
47
Graduate
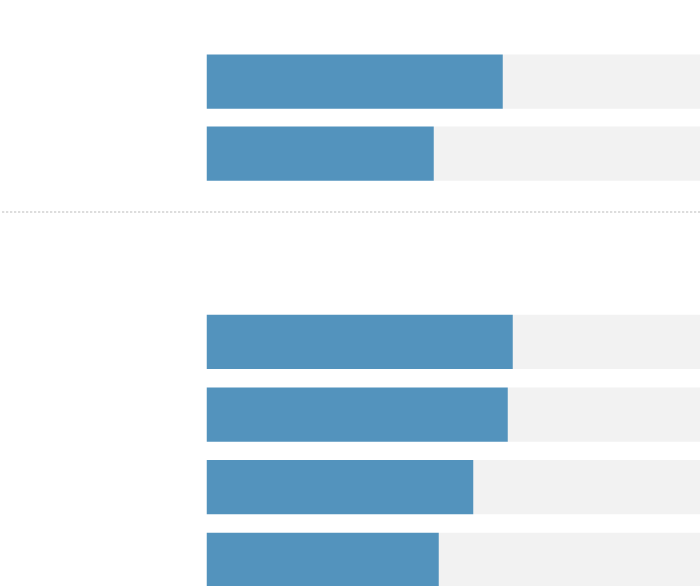
Highest degree
60% Homegrown
Bachelor’s
Graduate
46
Parent’s education level
High school
or below
62%
Some college
or associates
61
Bachelor’s
54
Graduate
47

They are also more likely to be Hispanic.
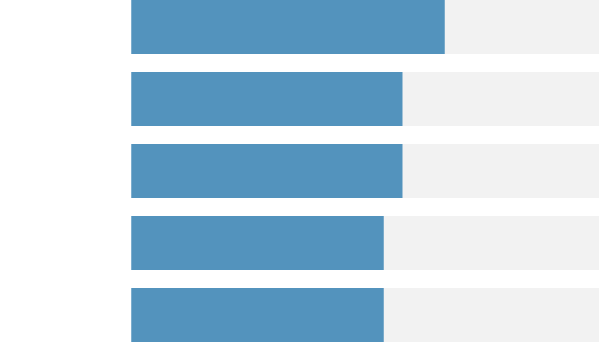
67% Homegrown
Hispanic
58
Black
58
Asian
54
White
54
Other

Hispanic
67% Homegrown
Black
58
Asian
58
White
54
Other
54
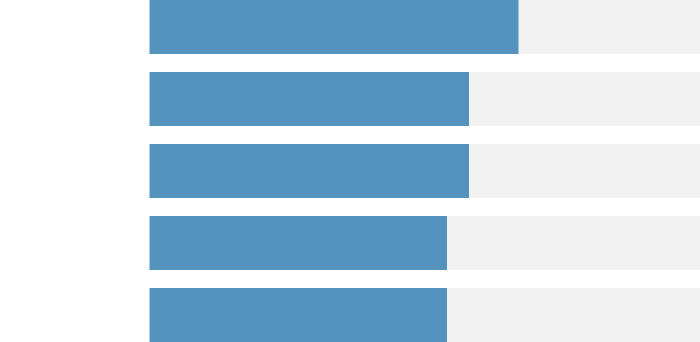
Hispanic
67% Homegrown
Black
58
Asian
58
White
54
Other
54

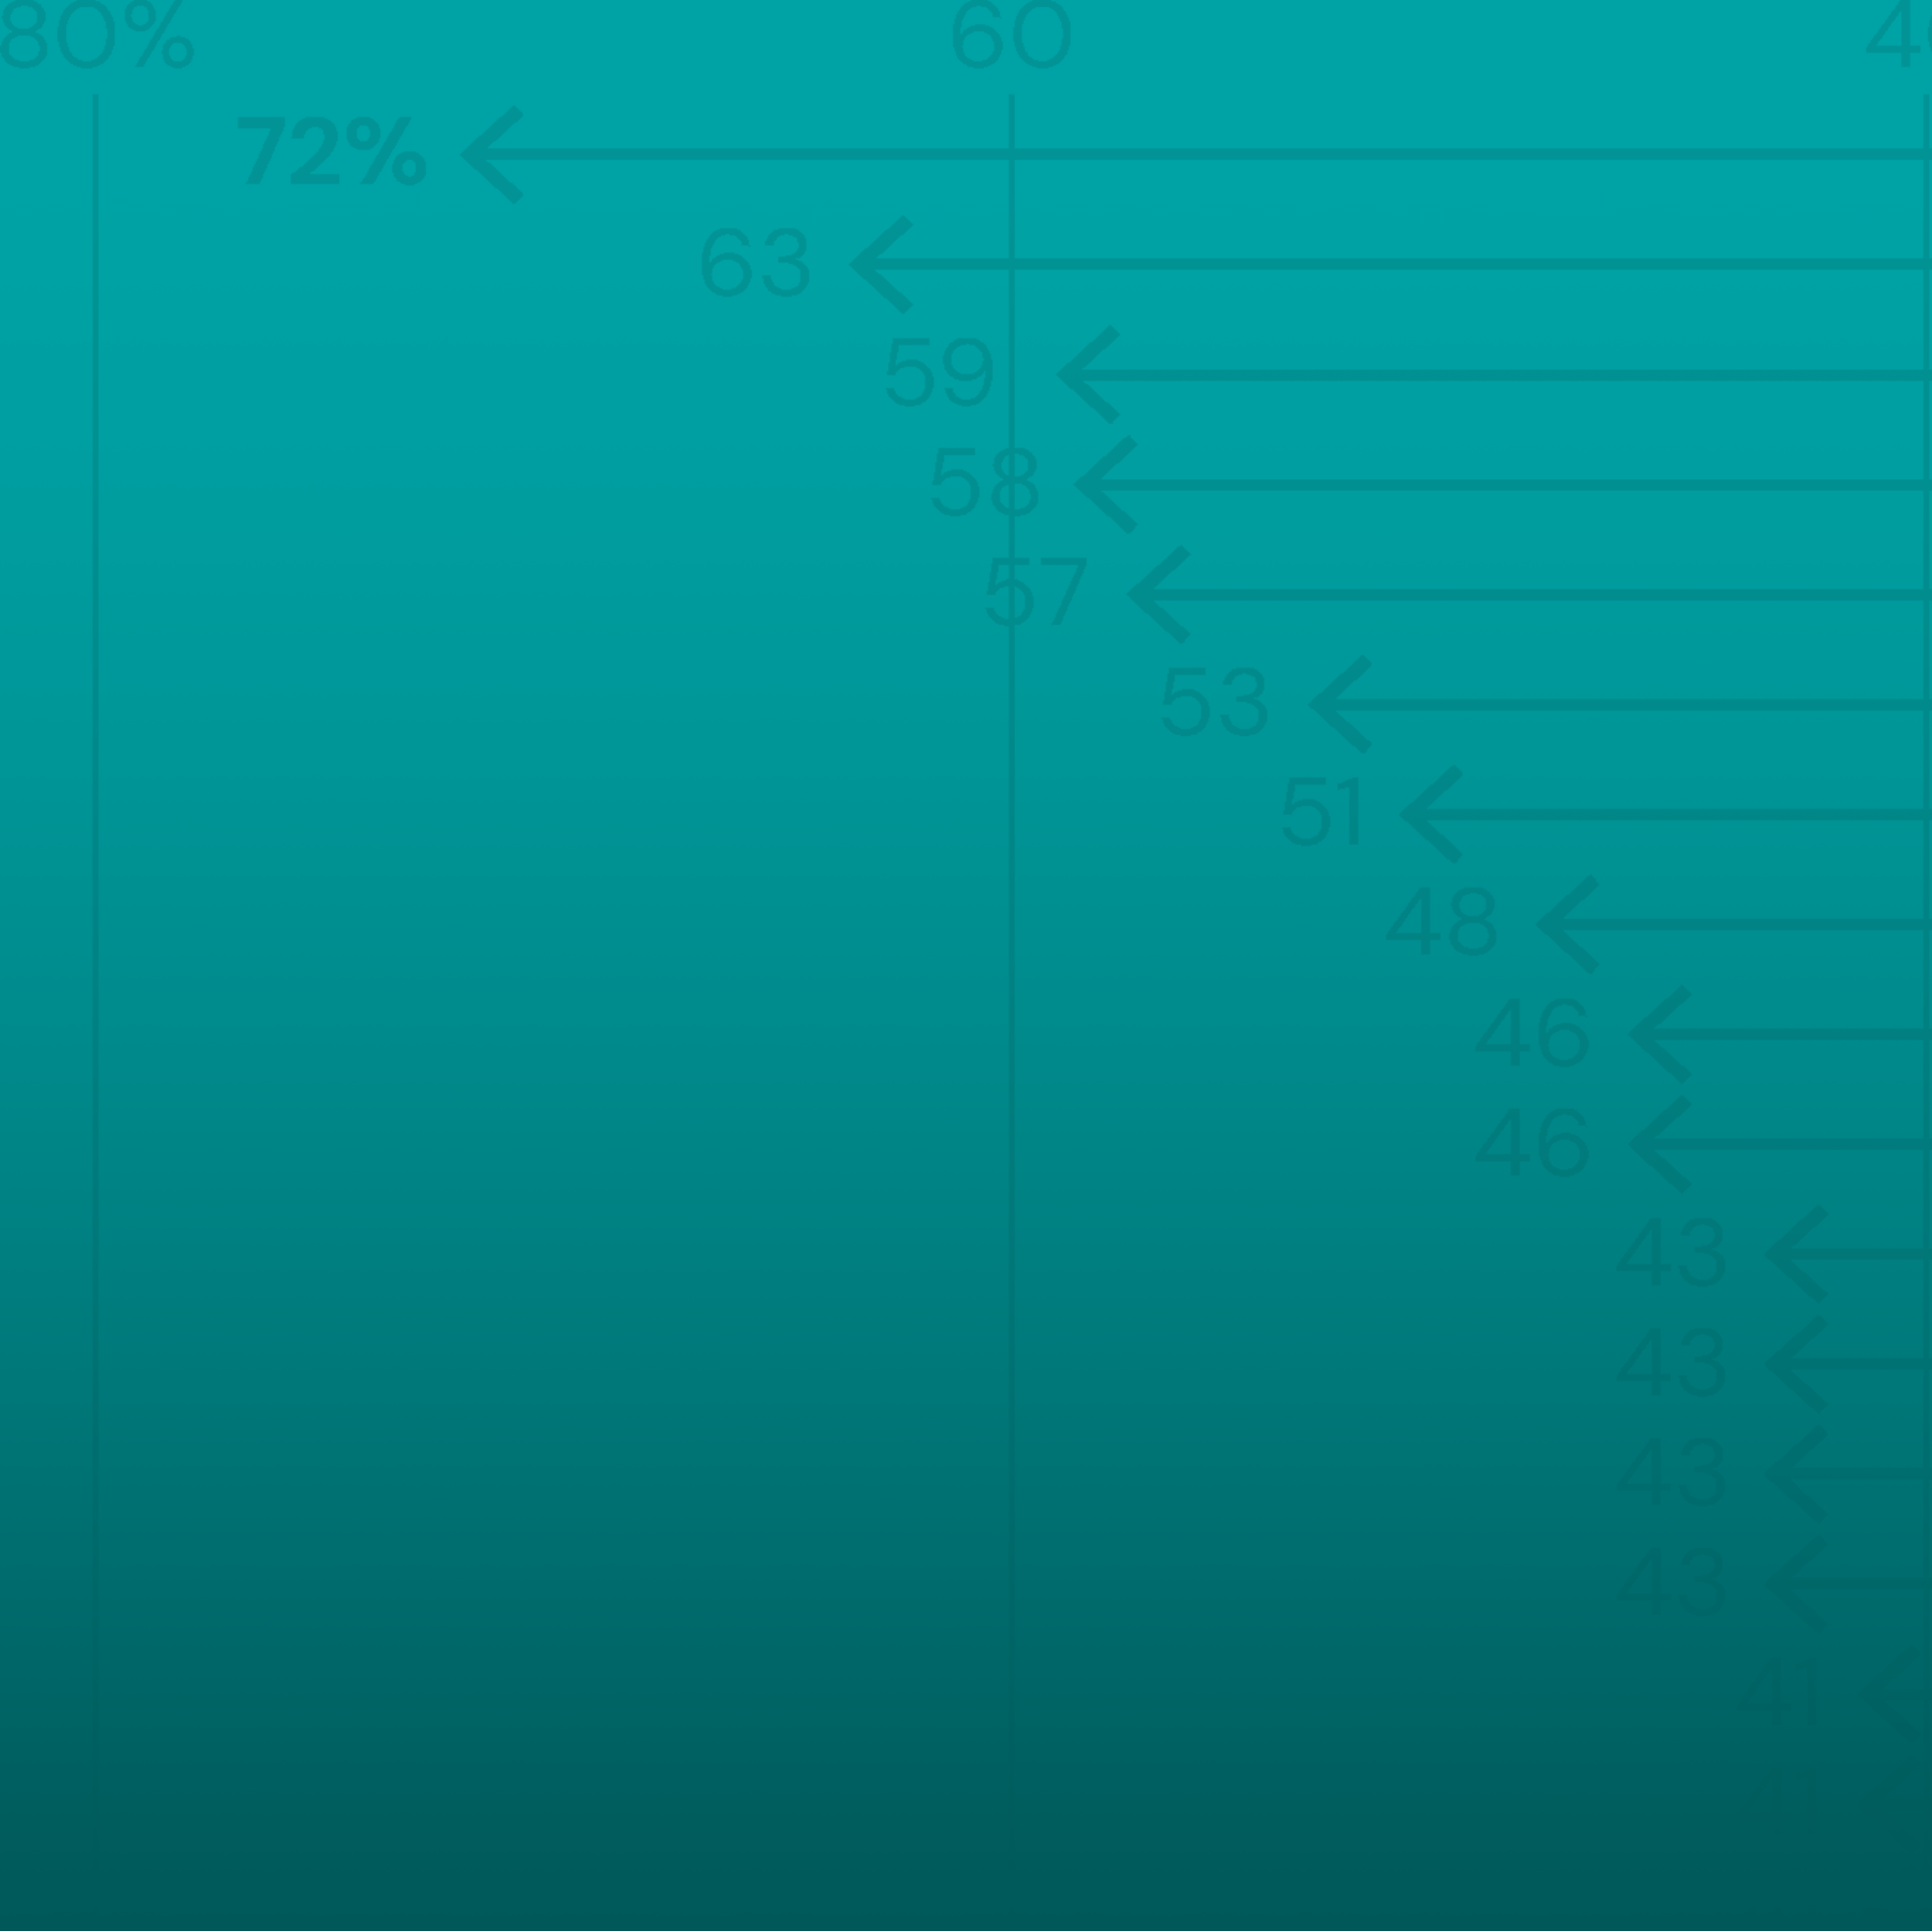
Not all states are retaining their college graduates, even as states make more attempts to hold onto their talent. States with the worst retention of college graduates, a phenomenon commonly known as “brain drain,” see many of their recent graduates of in-state colleges leave the state.
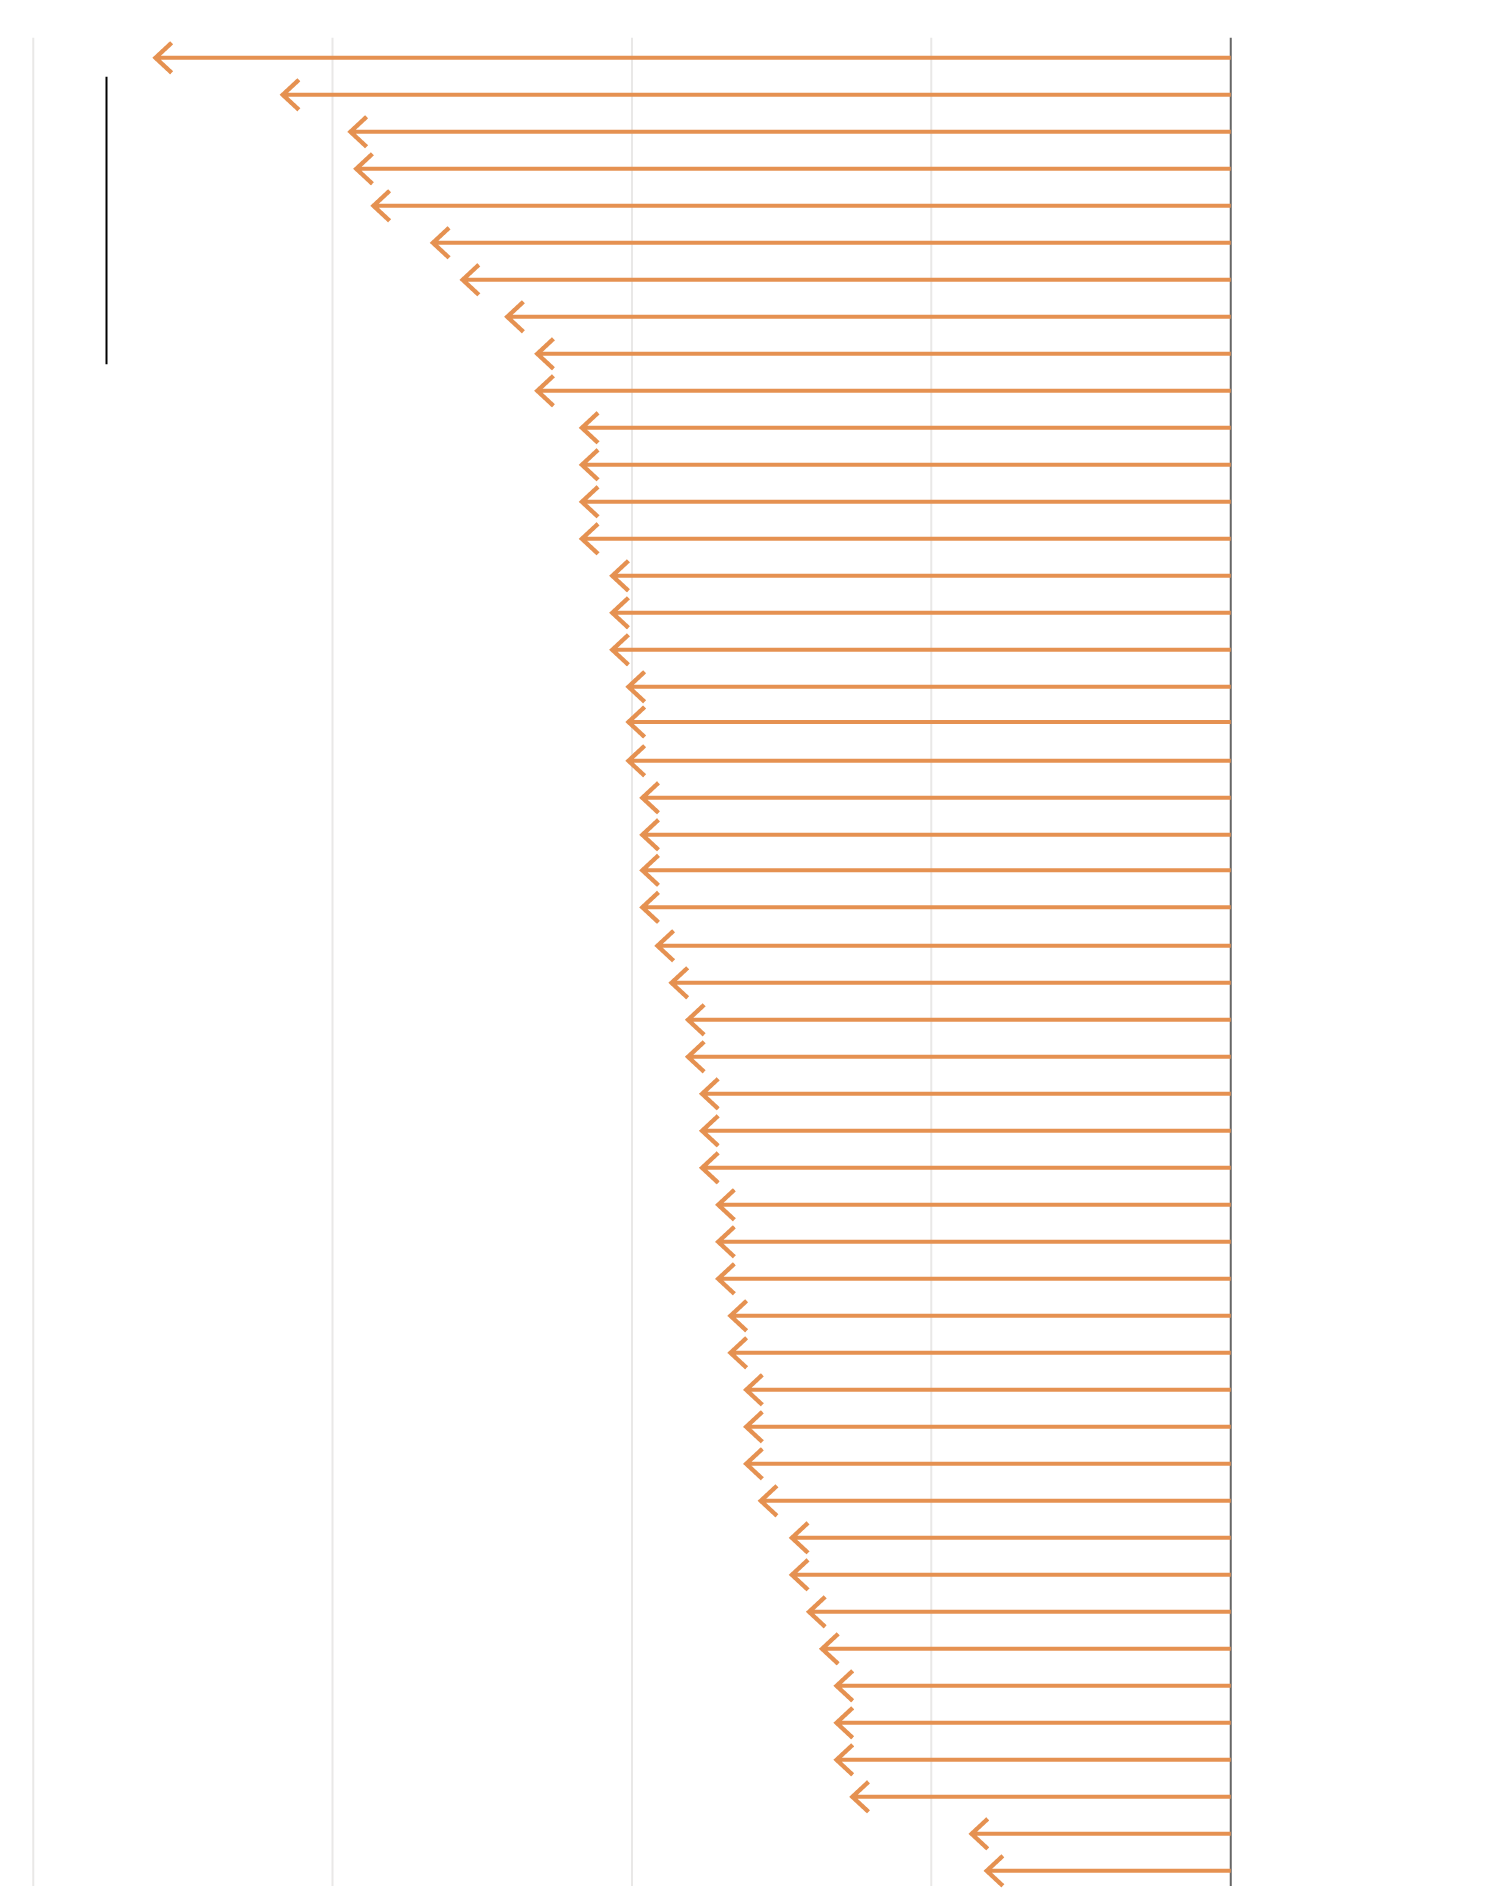
80%
60
40
20
Vermont
72%
New Hampshire
63
West Virginia
59
Rhode Island
58
Arizona
57
Delaware
53
Idaho
51
North Dakota
48
Massachusetts
46
Utah
46
72% of graduates in
Vermont relocate.
Alabama
43
Connecticut
43
Kansas
43
Virginia
43
Indiana
41
Maryland
41
Minnesota
41
Maine
40
Pennsylvania
40
South Dakota
40
Colorado
39
Hawaii
39
Mississippi
39
Missouri
39
Iowa
38
Wyoming
37
Montana
36
Oregon
36
New Mexico
35
South Carolina
35
Wisconsin
35
Illinois
34
New York
34
North Carolina
34
Louisiana
33
Tennessee
33
Arkansas
32
Kentucky
32
Ohio
32
Alaska
31
Nebraska
29
Oklahoma
29
Florida
28
Michigan
27
Georgia
26
New Jersey
26
Washington
26
Nevada
25
California
17
Texas
16
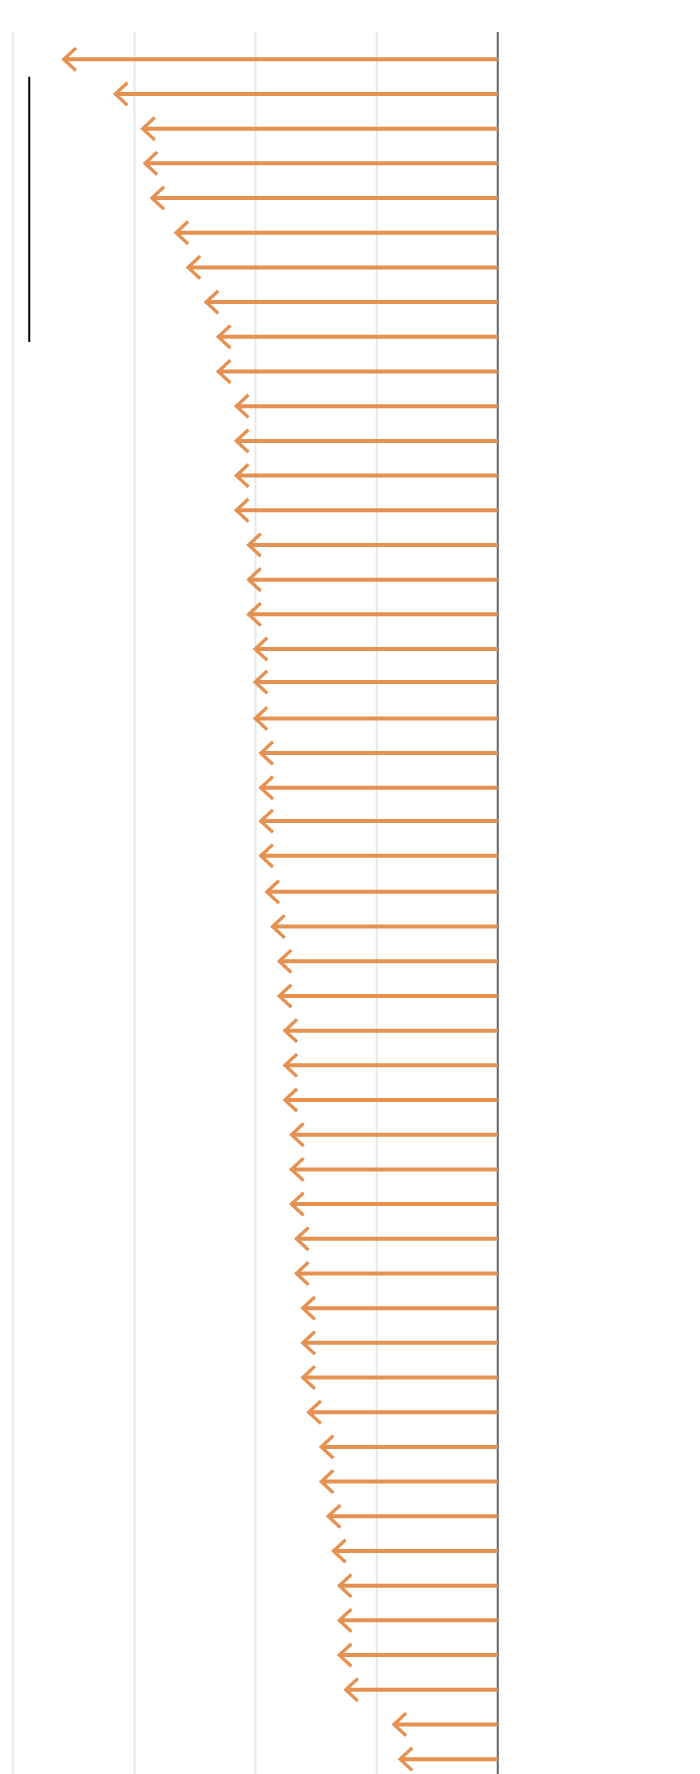
80%
60
40
20
72%
Vermont
63
New Hampshire
59
West Virginia
58
Rhode Island
57
Arizona
53
Delaware
51
Idaho
48
North Dakota
46
Massachusetts
72% of
graduates
in Vermont
relocate.
46
Utah
43
Alabama
43
Connecticut
43
Kansas
43
Virginia
41
Indiana
41
Maryland
41
Minnesota
40
Maine
40
Pennsylvania
40
South Dakota
39
Colorado
39
Hawaii
39
Mississippi
39
Missouri
38
Iowa
37
Wyoming
36
Montana
36
Oregon
35
New Mexico
35
South Carolina
35
Wisconsin
34
Illinois
34
New York
34
North Carolina
33
Louisiana
33
Tennessee
32
Arkansas
32
Kentucky
32
Ohio
31
Alaska
29
Nebraska
29
Oklahoma
28
Florida
27
Michigan
26
Georgia
26
New Jersey
26
Washington
25
Nevada
17
California
16
Texas

Note: A state's “brain drain” is the percentage of the graduates produced by its in-state institutions who move to a different state.
Economic opportunity was the most commonly reported reason for interstate moves in the prior year among college-educated individuals ages 20–65.
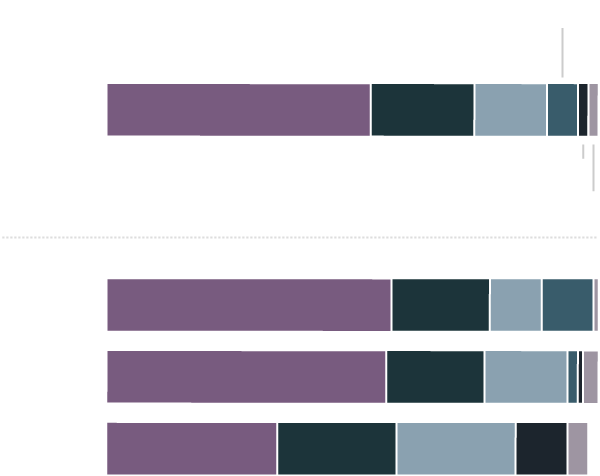
Education
Economic
opportunity
Housing/
community
Family
Ages
20-65
51%
20
14
6
Retirement
Climate
55
10
19
10
20-34
54
19
16
35-49
33
23
23
10
4
50-65
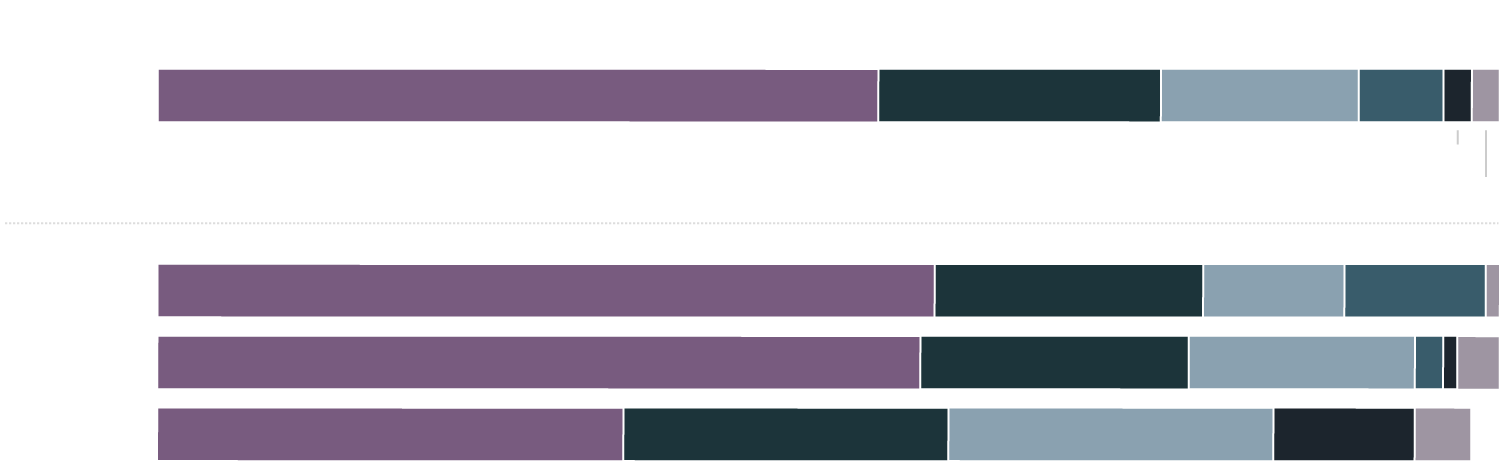
Housing/
community
Economic opportunity
Education
Family
Ages
20-65
51%
20
14
6
Retirement
Climate
55
19
10
10
20-34
54
16
19
35-49
33
23
23
10
4
50-65
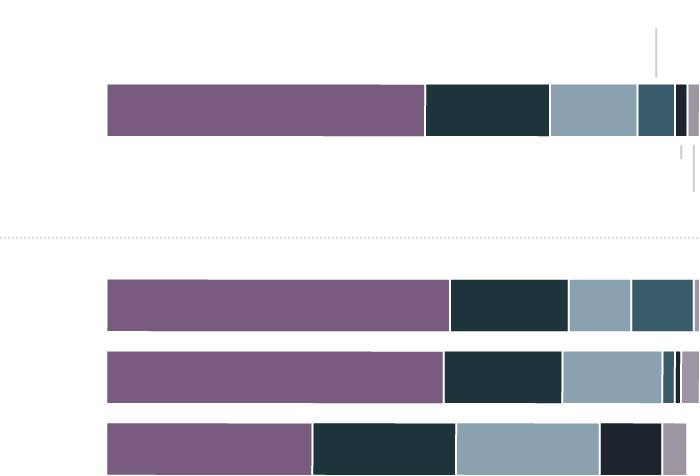
Education
Economic
opportunity
Housing/
community
Family
Ages
20-65
51%
20
14
6
Retirement
Climate
55
19
10
10
20-34
54
19
16
35-49
33
23
23
10
4
50-65

Note: Graduates who responded ‘Other’ are not represented.
College-educated talent is vital to a state’s workforce, though where it comes from varies by state.
A state's success in retaining its college graduates is related to a number of factors, such as economic growth, investment in higher education, cost of living, and quality of life, among other factors.