

Beyond the Average: The Uneven Geography of College ROI


The debate over whether college is worth it tends to swing between two familiar claims: that bachelor’s degrees lead to strong earnings gains and that too many graduates struggle to find good jobs.
But how can both be true? These contradictory claims exist because the benefits of higher education are usually calculated either on average or for the median student. But degree holders do not pool their earnings and then divide them equally so everyone gets the average amount, and by definition, half of graduates earn less than the median. A more relevant measure for prospective students and their families would help answer the question: How likely is it that college will be worth it for me? When we go beyond a focus on average earnings or median income, we learn much more about how likely a bachelor’s degree is to pay off for an individual. For example:
- Graduates living in metropolitan areas are more likely than those in rural communities to get an income boost from a bachelor’s degree.
- Living where there is a greater concentration of college graduates is linked to a greater likelihood of an earnings benefit for completing college.
- Over the past decade, the number of college graduates out-earning their high school-educated peers has declined in most states.
- Compared to white, Asian, or male graduates, fewer Black, Hispanic, or female graduates experience an earnings benefit from a college degree — though most still do.
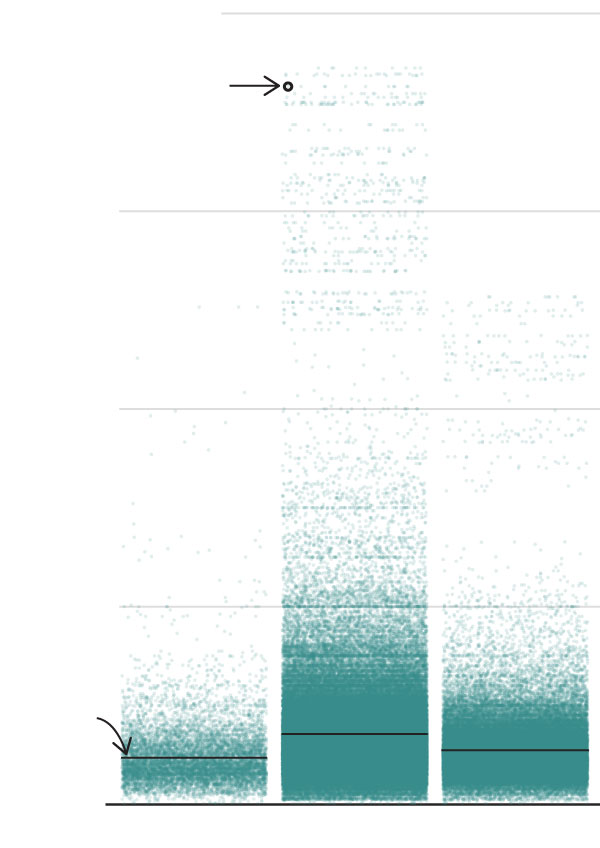
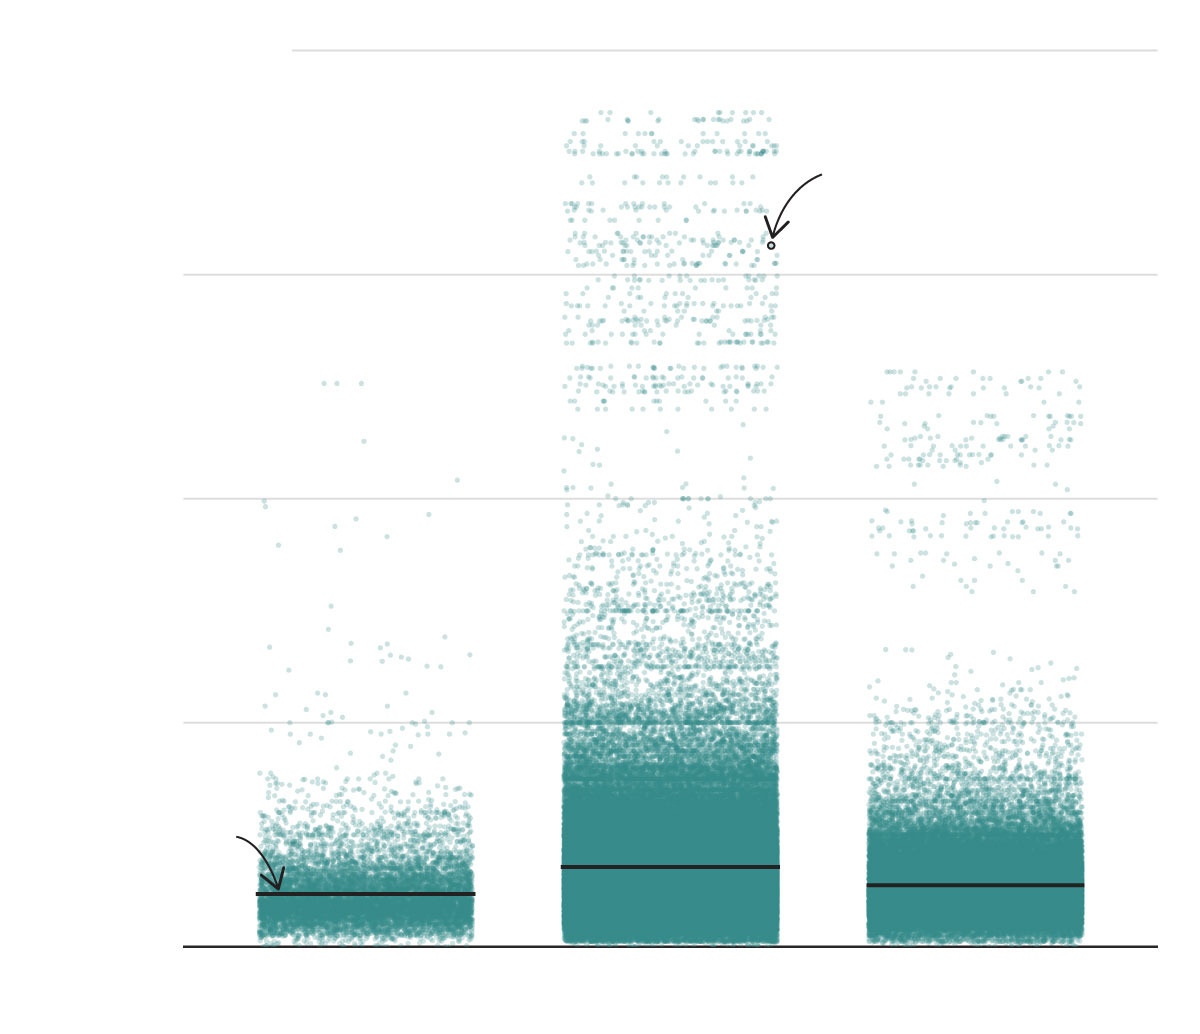
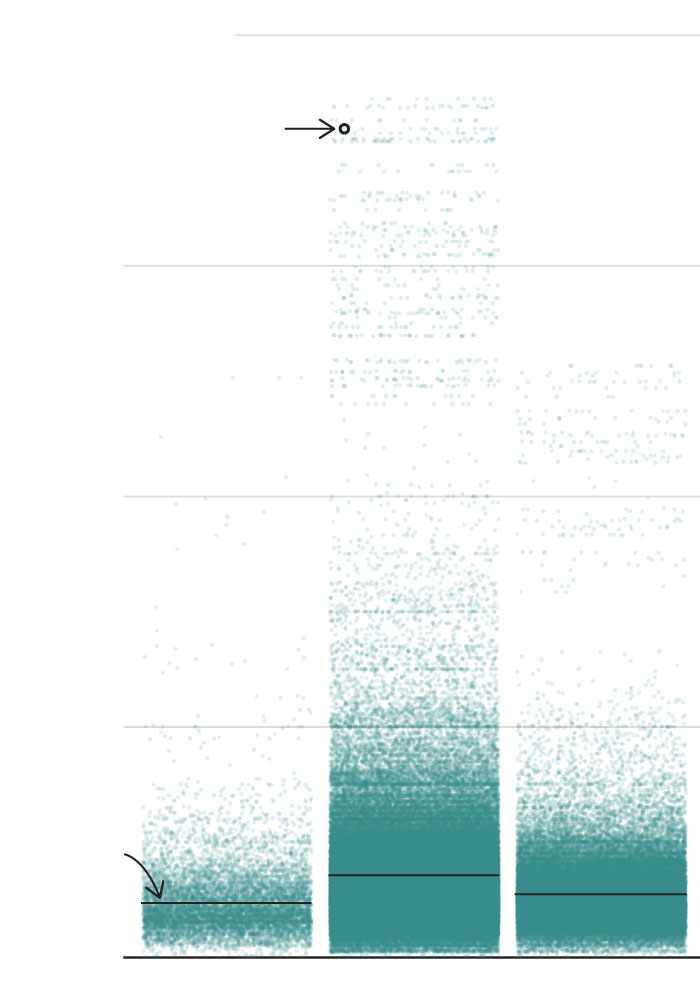
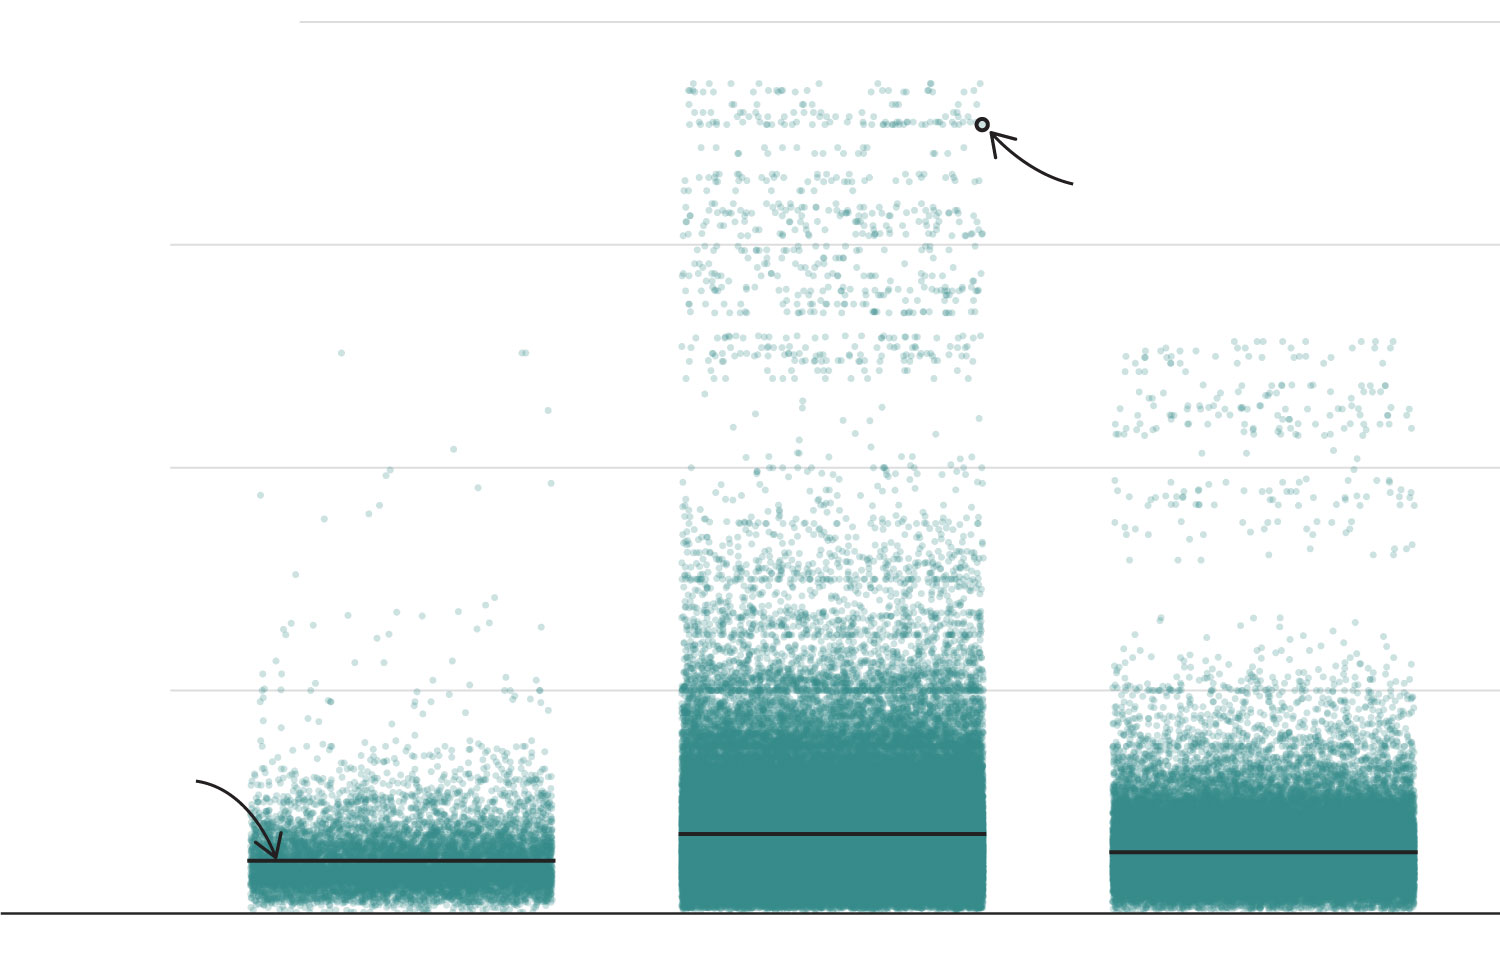
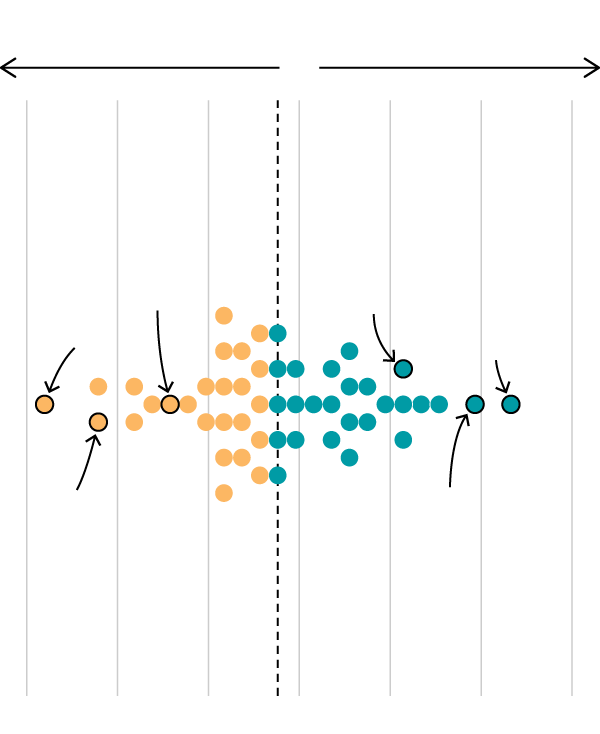
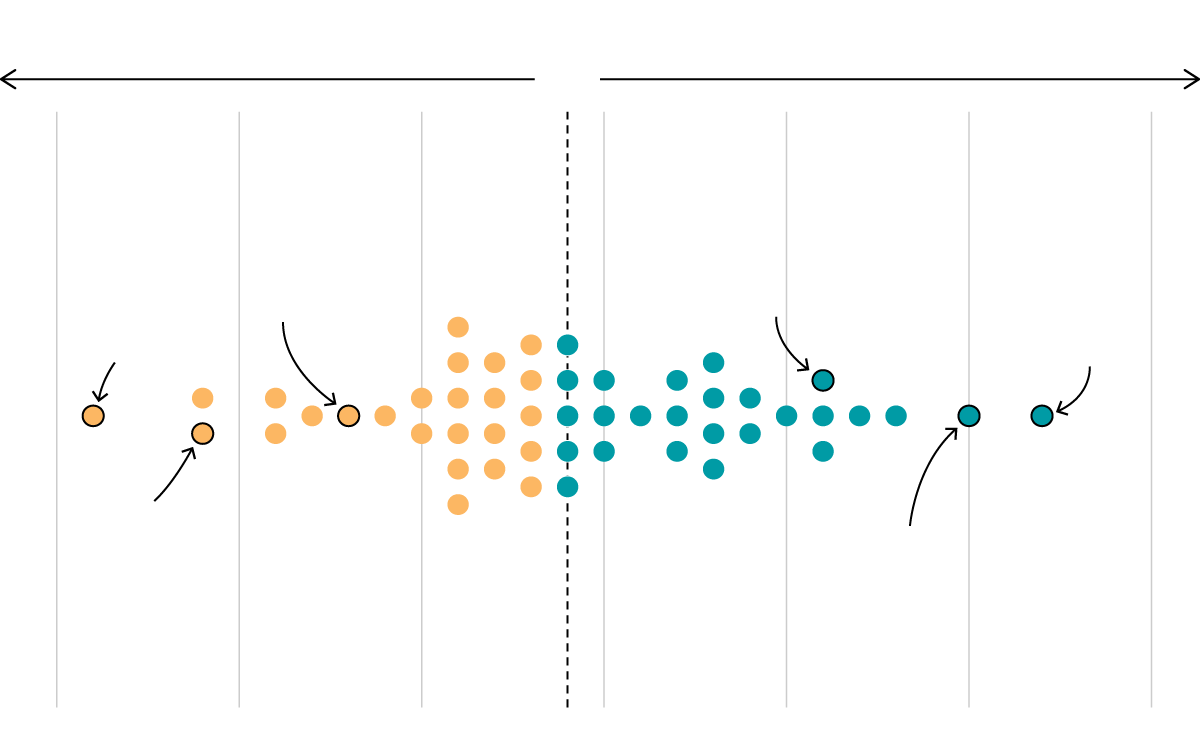
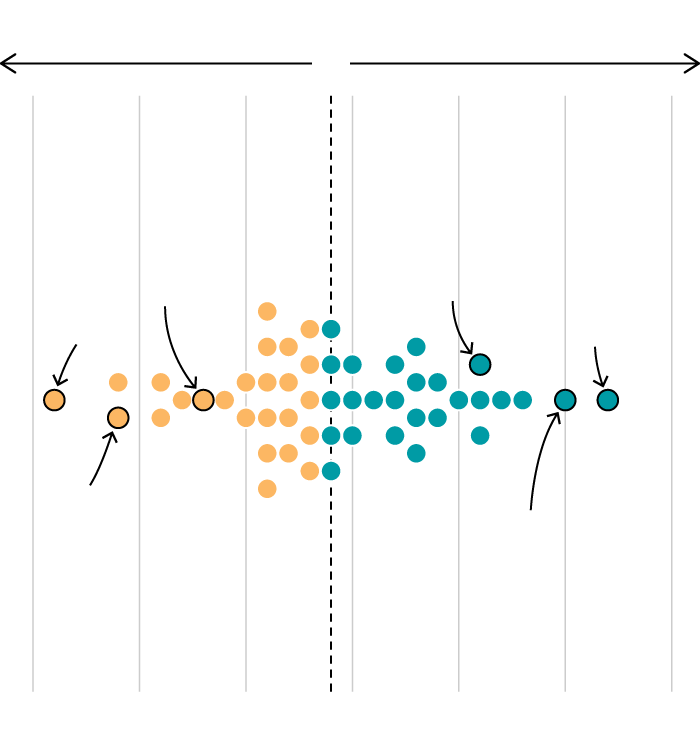
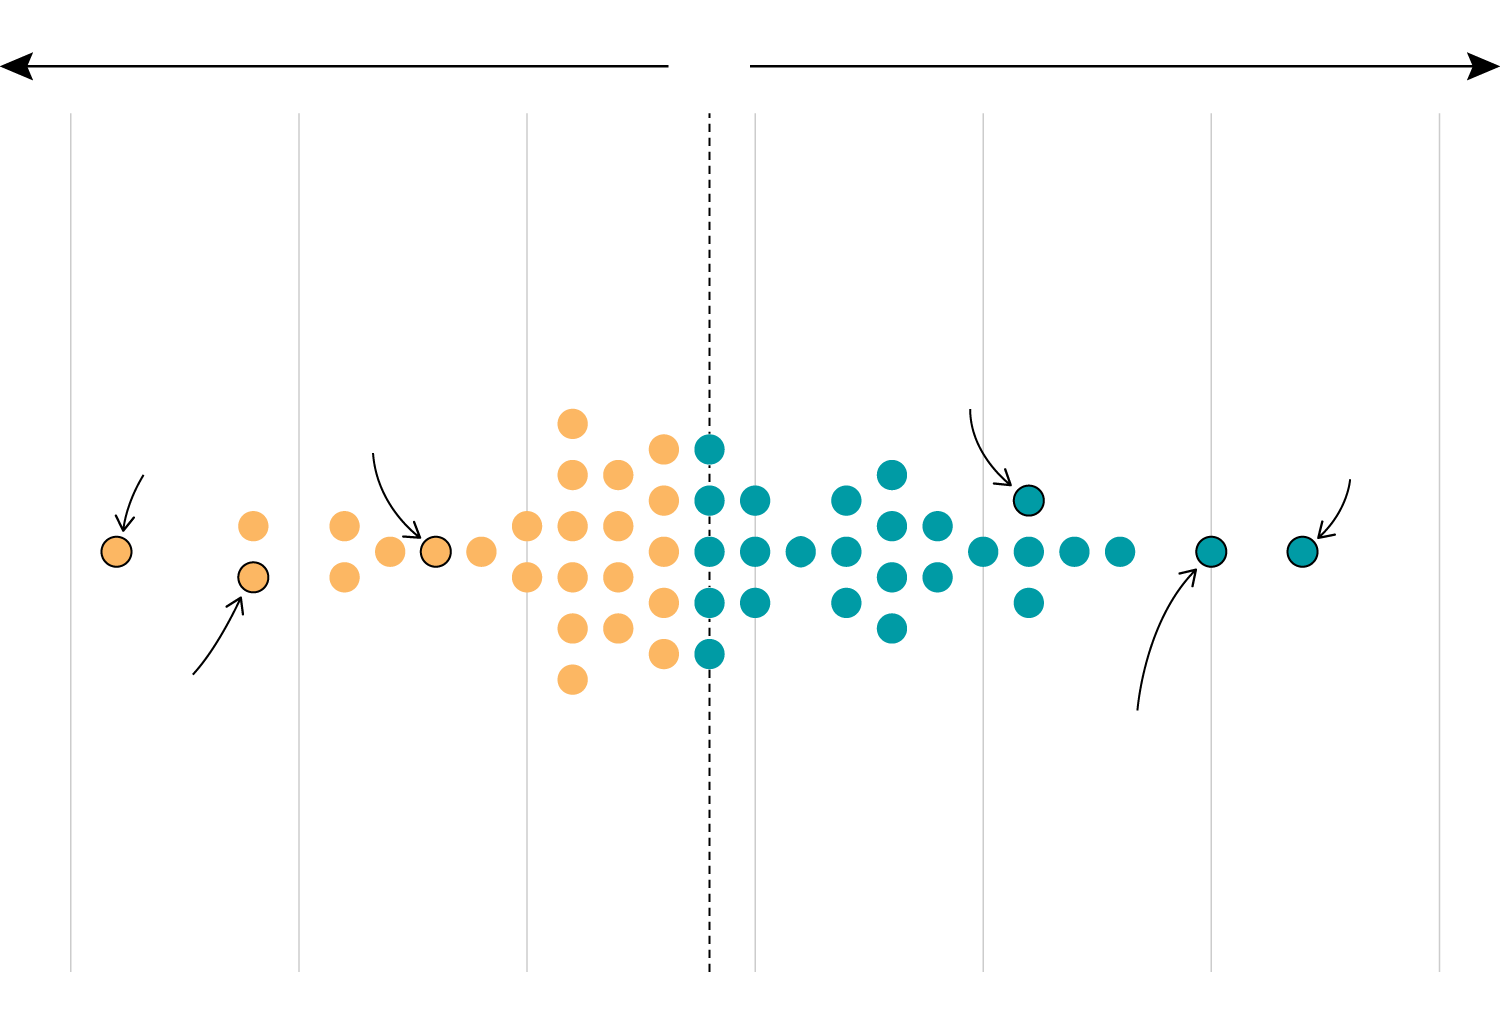
The figure below shows the income distributions for graduates in three states with different demographic and economic profiles, illustrating the broad range of outcomes on either side of the average. These figures — and all analyses in this brief — refer to individuals with a terminal bachelor’s degree (a bachelor’s degree but no graduate degrees).
$800,000 dollars
One graduate’s
individual income
Among College Graduates, Income Varies Sharply by State
600,000
Income distribution of bachelor’s degree graduates ages 25-34 working full-time in three states
400,000
Note: Average income is rounded.
Source: Authors' analysis of U.S. Census Bureau, American Community Survey (ACS) 2020–2024 5-year estimates, accessed via IPUMS USA (University of Minnesota), https://usa.ipums.org.
200,000
Average
income
$71,000
$54,000
$47,000
Montana
New Jersey
Wisconsin
$800,000 dollars
One graduate’s
individual income
600,000
400,000
200,000
Average
income
$71,000
$54,000
$47,000
Montana
New Jersey
Wisconsin
$800,000 dollars
One graduate’s
individual income
600,000
400,000
200,000
Average
income
$71,000
$54,000
$47,000
Montana
New Jersey
Wisconsin
$800,000 dollars
One graduate’s
individual income
600,000
400,000
200,000
Average
income
$71,000
$54,000
$47,000
Montana
New Jersey
Wisconsin
One way to give students more information about how likely it is that college will pay off for them is to make the odds transparent.
Looking at outcomes this way — through the full distribution of individual earnings — reveals a clear pattern: The odds are not equal. Graduates living in metropolitan areas and places where more residents have bachelor’s degrees are more likely to get a payoff than those living in rural areas and places where fewer residents have bachelor’s degrees. Outcome gaps persist in terms of race and ethnicity as well: Going beyond the averages helps us uncover which places and people face more uncertain ascents to the benefits of their college degree.
Geography matters
We know that the financial returns of a college degree depend greatly on the field of study.1 They also depend on the opportunities a student has while studying. For example, having an internship or working at any kind of job while in college are associated with higher earnings post-college.2 An additional aspect that is often overlooked, however, is geography. The data clearly show that there are some parts of the country where college graduates are much more likely to reap a return on their investment than other areas.
For example, bachelor’s degree holders in New York and California are much more likely to have a positive return on their investment compared to bachelor’s degree graduates in Vermont, North Dakota, or Wyoming. Their degree will provide them with an income boost above that of a high school completer in their state that will more than pay for the cost of their education within 10 years of completing their degree.
A College Degree Pays Off for Most Graduates, but Returns Vary Widely by State
Fewer graduates
with positive ROI
More graduates
with positive ROI
Percentage of bachelor’s degree graduates with a positive 10-year return on investment by state
National average
69%
West Virginia
New Jersey
Vermont
Washington D.C.
Note: Positive ROI is calculated for graduates working full-time. Costs are based on an enrollment-weighted average of net price at public institutions in each state. Percents are rounded.
Wyoming
In New York, 80% of
recent bachelor's
degree graduates
see a positive ROI,
exceeding the
national average.
Source: 2025 State Opportunity Index: Measuring state progress in connecting education with opportunity. Strada Education Foundation.
55
60
65
70
75
80
85%
Fewer graduates
with positive ROI
More graduates
with positive ROI
National average
69%
New Jersey
West Virginia
Washington D.C.
Vermont
Wyoming
In New York, 80% of recent bachelor's
degree graduates see a positive ROI,
exceeding the national average.
55
60
65
70
75
80
85%
Fewer graduates
with positive ROI
More graduates
with positive ROI
National average
69%
New Jersey
West Virginia
Washington D.C.
Vermont
Wyoming
In New York, 80% of
recent bachelor's
degree graduates
see a positive ROI,
exceeding the
national average.
55
60
65
70
75
80
85%
Fewer graduates with positive ROI
More graduates with positive ROI
National average
69%
New Jersey
West Virginia
Washington D.C.
Vermont
Wyoming
In New York, 80% of recent bachelor's
degree graduates see a positive ROI,
exceeding the national average.
55
60
65
70
75
80
85%
Where College Pays Off Most — and Least
Fewest graduates
with positive ROI
Most graduates
with positive ROI
56%
82%
Vermont
Washington D.C.
States with the highest and lowest percent of bachelor’s degree graduates experiencing positive return on investment
59
80
Wyoming
New York
59
78
North Dakota
California
61
77
Rhode Island
Alaska
Note: Percents are rounded.
61
76
Idaho
Illinois
Source: 2025 State Opportunity Index: Measuring state progress in connecting education with opportunity. Strada Education Foundation.

Fewest graduates
with positive ROI
Most graduates
with positive ROI
56%
82%
Vermont
Washington D.C.
59
80
Wyoming
New York
59
78
North Dakota
California
61
77
Rhode Island
Alaska
61
76
Idaho
Illinois

Fewest graduates
with positive ROI
Most graduates
with positive ROI
56%
82%
Vermont
Washington D.C.
59
80
Wyoming
New York
59
78
North Dakota
California
61
77
Rhode Island
Alaska
61
76
Idaho
Illinois
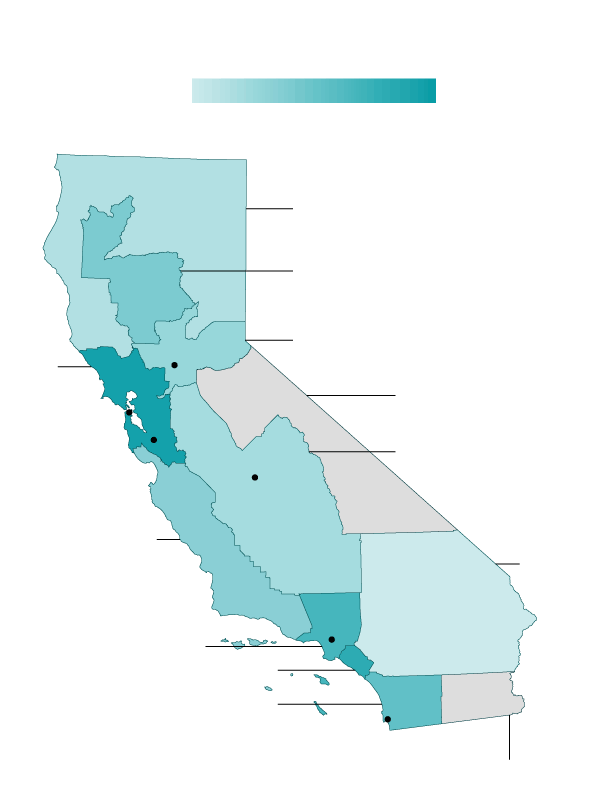
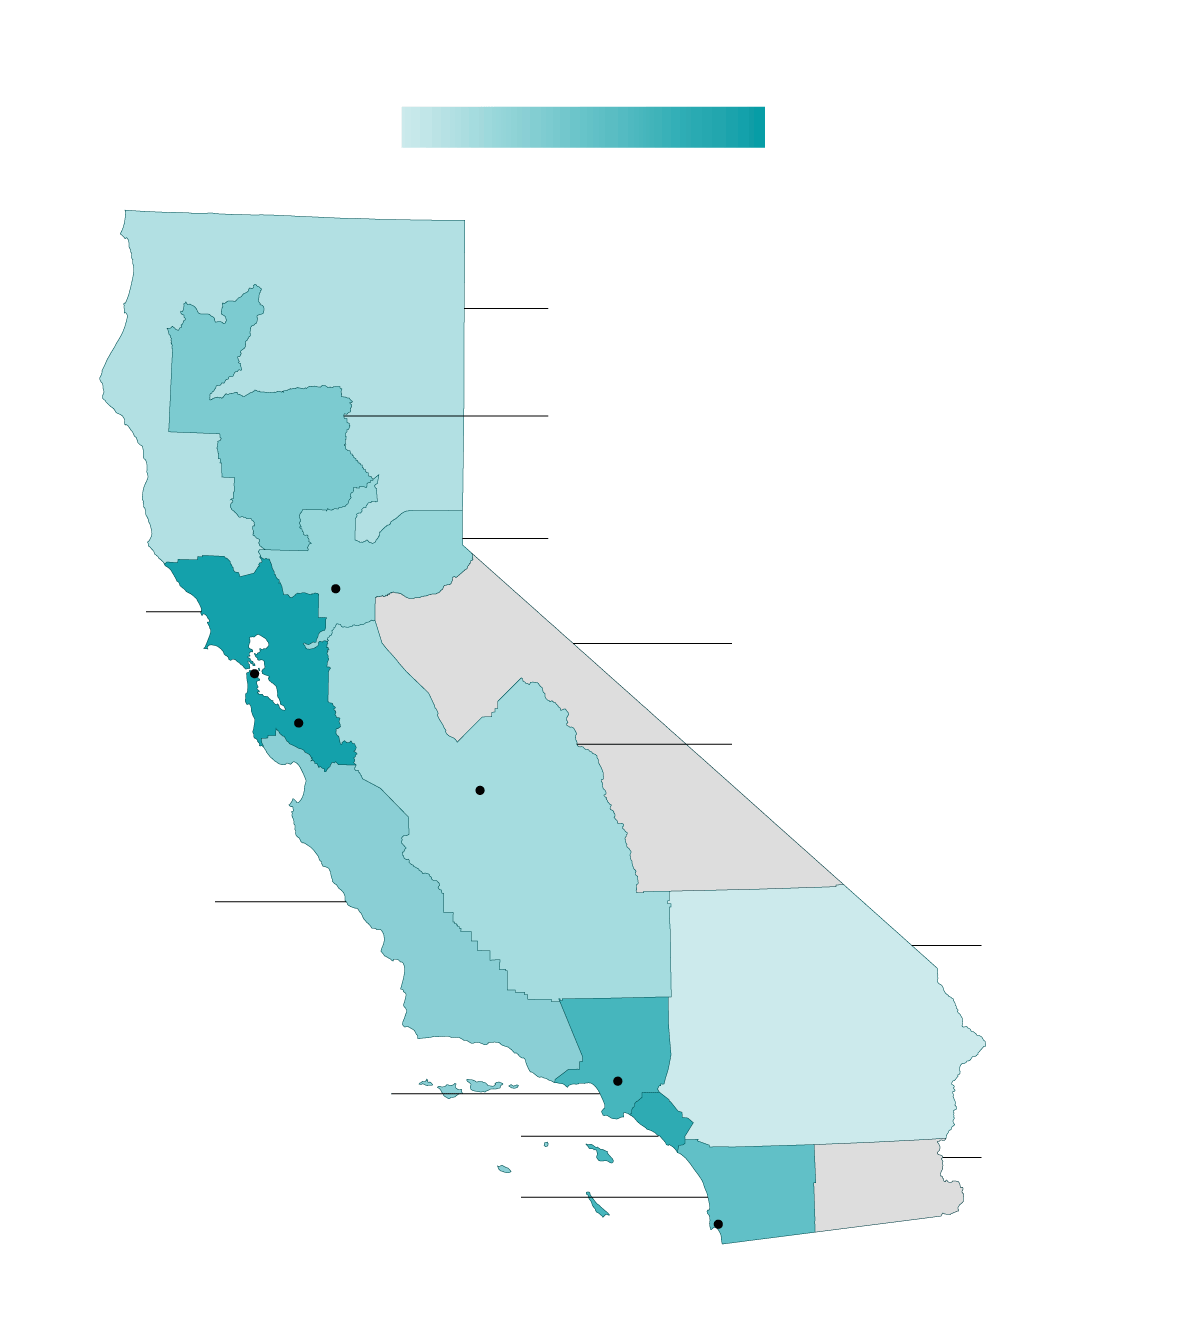
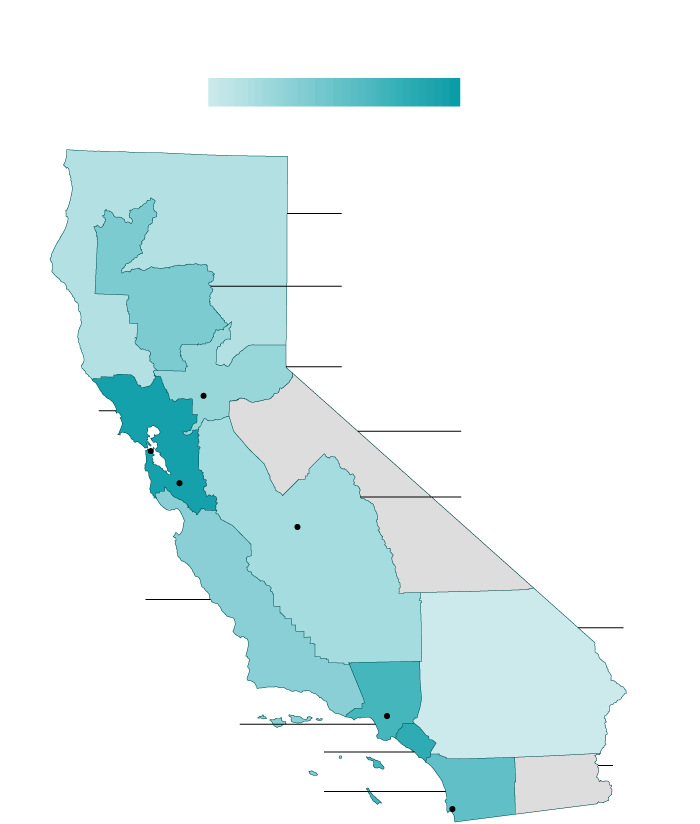
These geographic differences don’t just exist across states — they also appear within them. For example, in California, bachelor's degree completers who live in coastal, metropolitan regions see their degrees pay off at higher rates than their peers who live in more rural, inland areas.
Share of graduates with a
positive return on investment
70%
85%
A College Degree Pays Off More on the Coast in California
North-Far North
Percentage of California bachelor’s degree graduates with a positive ROI, by region
Upper Sacramento Valley
Sacramento-Tahoe
Bay
Area
Sacramento
Note: Positive ROI is calculated for graduates working full-time. Costs are based on an enrollment-weighted average of net price at public institutions in each state. Data for Central Sierra and Imperial regions are not shown due to insufficient data. Percents are rounded.
Central Sierra
San Francisco
San Joaquin
Valley
San Jose
Fresno
Central Coast
Inland
Empire
Source: Wolf-Johnson, M. (2026). Degrees of value: Exploring how college ROI in California differs by region. California Competes.
Los Angeles
Los Angeles
Orange
San Diego
San Diego
Imperial
Share of graduates with a
positive return on investment
85%
70%
North-Far North
Upper Sacramento Valley
Sacramento-Tahoe
Sacramento
Bay Area
Central Sierra
San Francisco
San Jose
San Joaquin Valley
Fresno
Central Coast
Inland Empire
Los Angeles
Los Angeles
Orange
Imperial
San Diego
San Diego
Share of graduates with a
positive return on investment
85%
70%
North-Far North
Upper Sacramento Valley
Sacramento-Tahoe
Sacramento
Bay Area
Central Sierra
San Francisco
San Joaquin
Valley
San Jose
Fresno
Central Coast
Inland
Empire
Los Angeles
Los Angeles
Orange
Imperial
San Diego
San Diego
These differences in positive ROI within the same state highlight that, while costs are certainly part of the equation, earnings differences drive much of the disparity.
The remainder of this brief sets aside the cost of education and focuses simply on the percentage of bachelor’s degree graduates who are out-earning the median high school completer in their state. When we focus solely on earnings, some additional patterns emerge.
The metropolitan premium
First, this is largely a story of differences in metropolitan concentration, with stronger outcomes in states where a greater share of the population live in metro areas. The clearest example of this is the District of Columbia, a completely metropolitan jurisdiction, where 90 percent of bachelor’s degree holders earn more than their peers with a high school diploma. In the least metropolitan state, Wyoming, it’s less than 70 percent.
College graduates in the District of Columbia, New York, New Jersey, Texas, Illinois, and California are the most likely to out-earn their high school-educated peers. In contrast, the bottom five states, where a college degree earnings premium is least likely, are Wyoming, Vermont, Hawaii, North Dakota, and West Virginia.
There are a few reasons earnings premiums may be higher for college graduates in metropolitan areas. Prior research has shown that the wider array of options for job seekers in metropolitan areas improves fit and maximizes productivity, leading to higher wages. Metropolitan areas also can enable greater cross-pollination of ideas as workers interact with each other and across companies, often leading to productivity gains and higher wages.3
Educational attainment
The states where premiums are most widespread also are those in which a greater share of the population has a bachelor’s degree. This may be because places that reward education attract college-educated people or because places with a college-educated talent pool tend to develop and grow industries that make good use of higher education. In all likelihood, it is both: a cycle of brain drain from areas of the country that do not have a critical mass of college-level jobs for graduates, and a reinforcing cycle of talent-driven economic development and innovation in cities that already are thriving.4
Historical trends
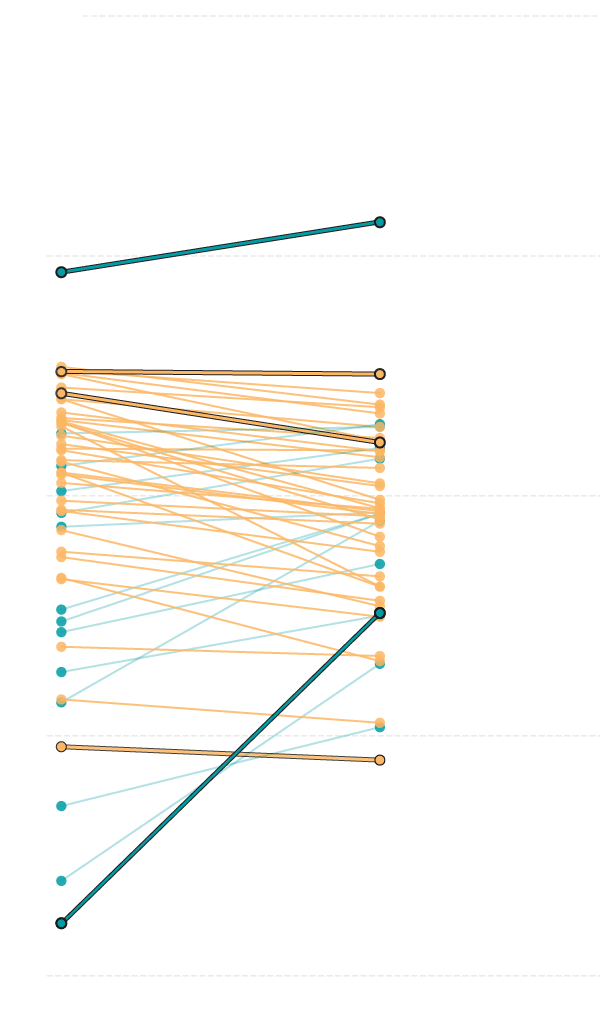
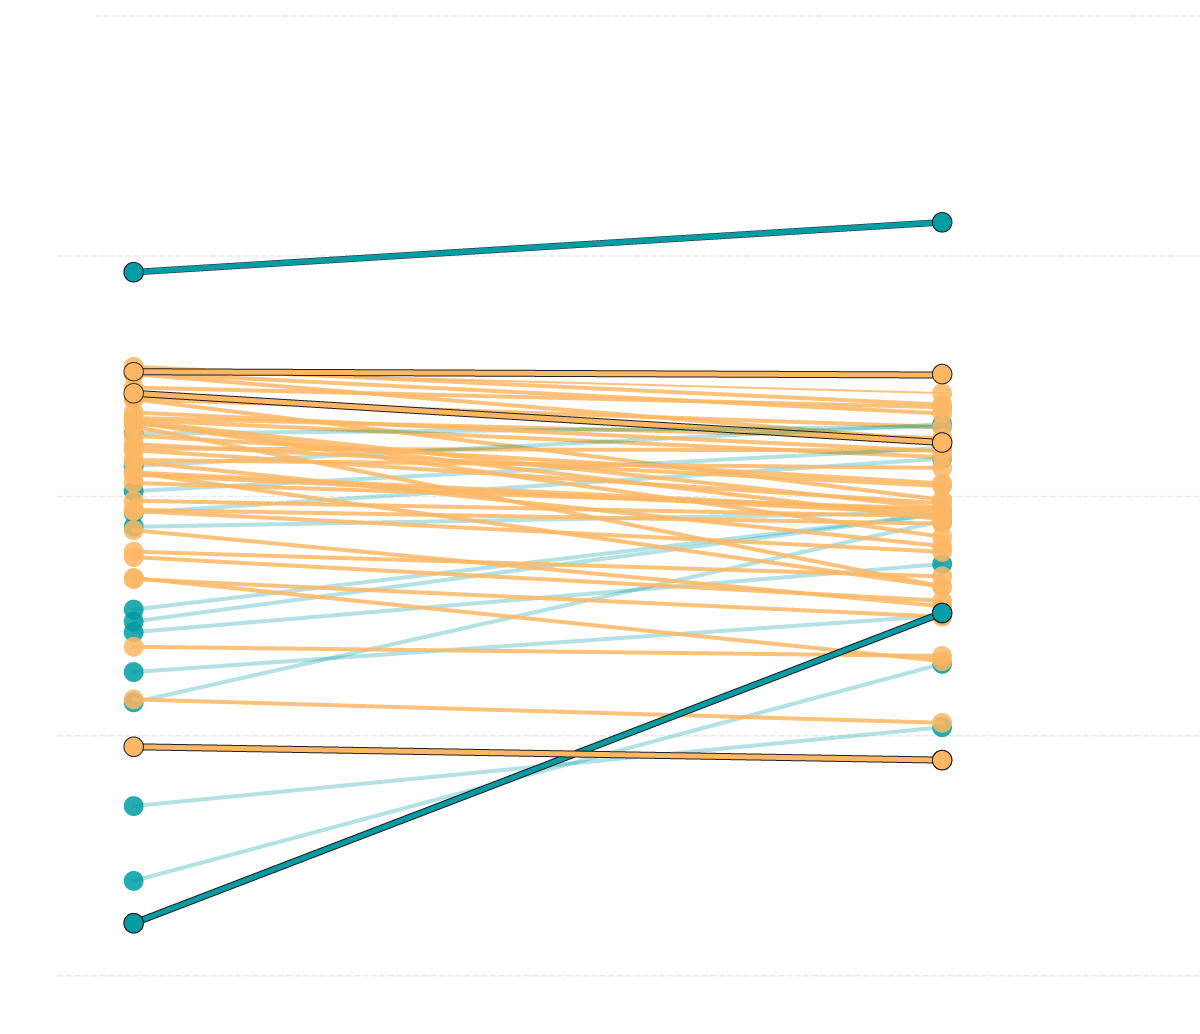
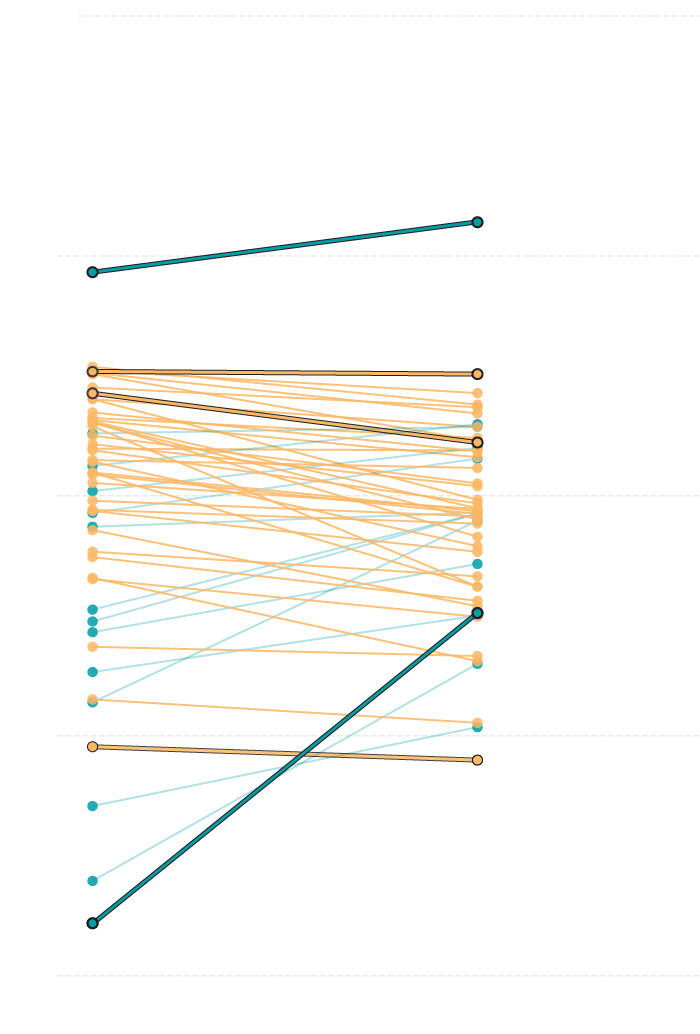
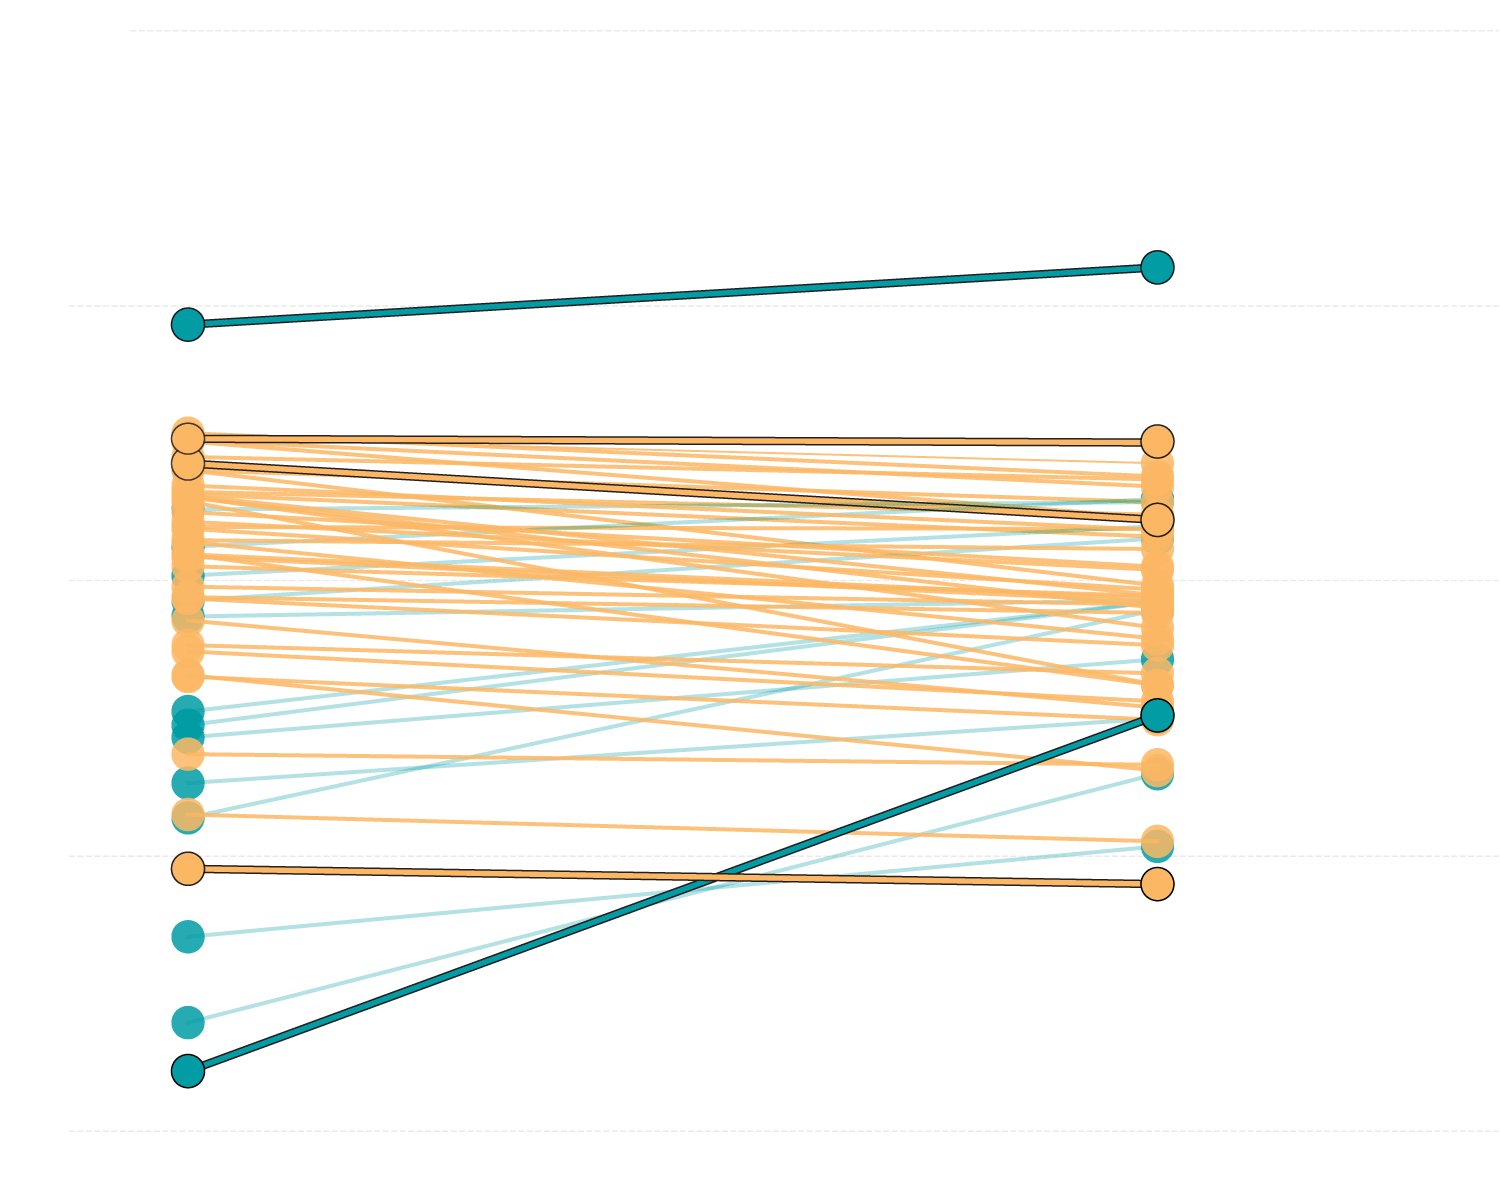
In most states, the percentage of bachelor’s degree graduates that are out-earning their high school peers is lower than it was 10 years ago. The share of bachelor’s degree holders earning more than the high school median in their state decreased in 37 states between 2013 and 2023.
100%
The share of college graduates
out-earning their high school
peers decreased in 37 states
over the last decade.
Washington D.C.
90
Across Most States, the College Earnings Premium Is Shrinking
New York
Massachusetts
80
Montana
70
Wyoming
Source: Authors' analysis of U.S. Census Bureau,
American Community Survey (ACS) 2020–2024
5-year estimates, accessed via IPUMS USA (University
60
2013
2023
100%
The share of college graduates out-earning
their high school peers decreased in 37 states
over the last decade.
Washington D.C.
90
New York
Massachusetts
80
Montana
70
Wyoming
2023
60
2013
100%
The share of college graduates
out-earning their high school
peers decreased in 37 states
over the last decade.
Washington D.C.
90
New York
Massachusetts
80
Montana
70
Wyoming
60
2013
2023
100%
The share of college graduates
out-earning their high school peers
decreased in 37 states over the last decade.
Washington D.C.
90
New York
Massachusetts
80
Montana
70
Wyoming
2023
60
2013
Who is most likely to see an earnings premium?
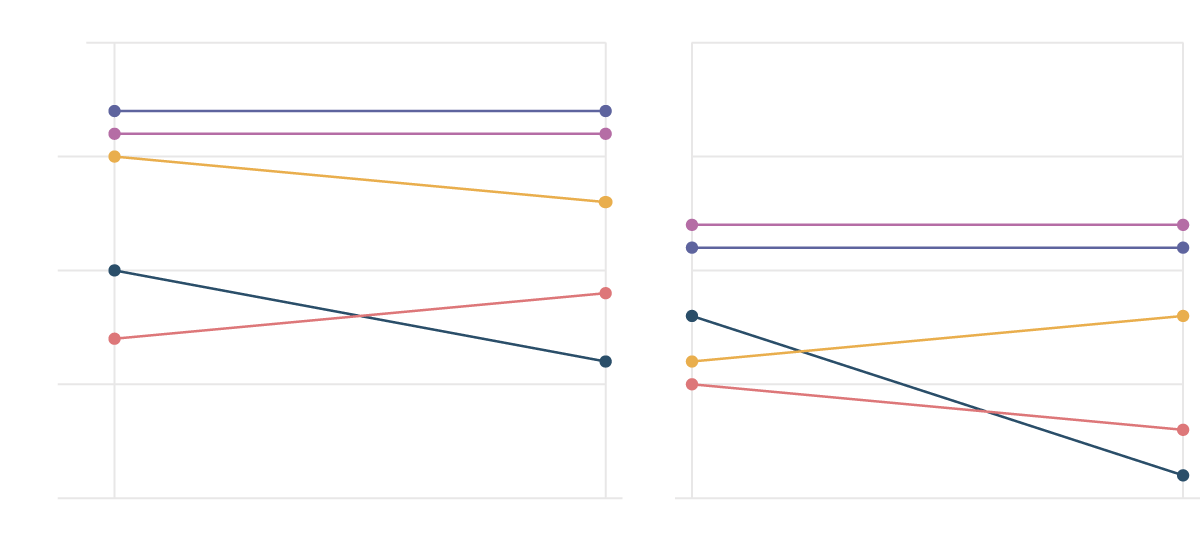
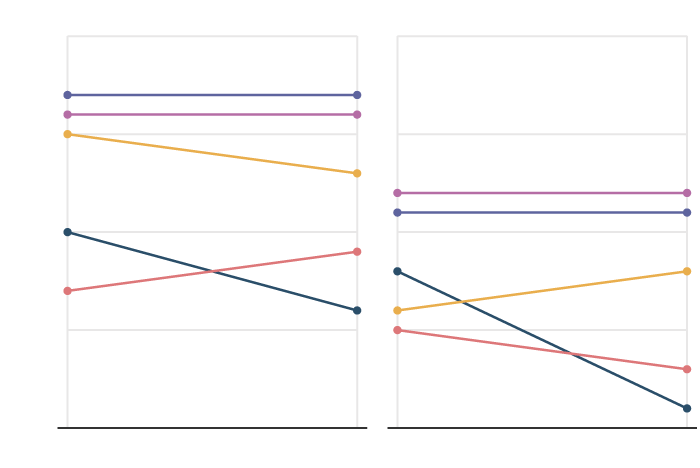
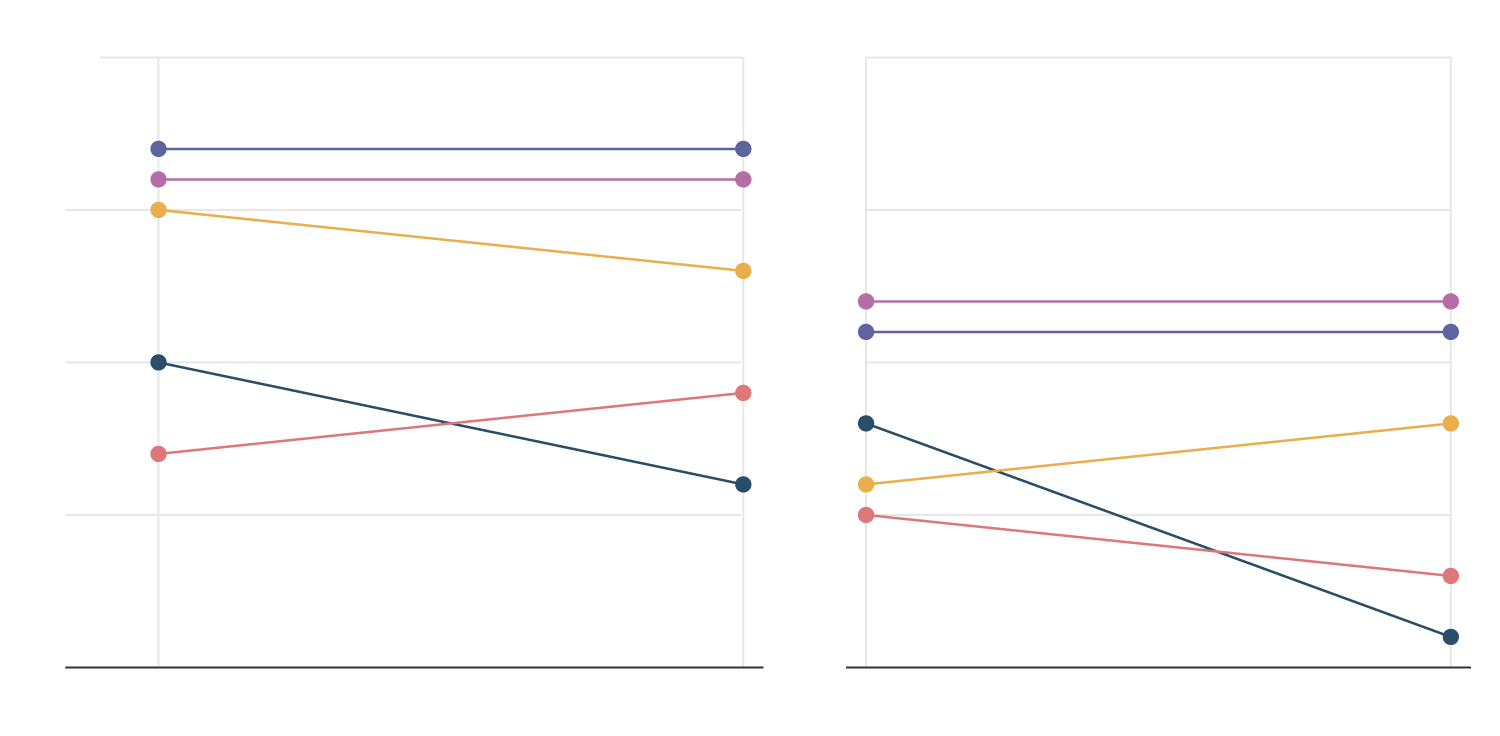
Looking at income beyond the median allows for a nuanced view of who is likely to experience a college earnings premium. For example, when we compare earnings by race, ethnicity, and sex, we see that:
- Compared to White and Asian peers of the same age and in the same state, Black and Hispanic college graduates are 5 to 10 percentage points less likely to out-earn the median high school completer.
- Female bachelor’s degree graduates of every race and ethnicity are less likely than male bachelor’s degree graduates to out-earn the median high school completer.
- When comparing patterns over time, earnings premiums are becoming scarcer for Black graduates.
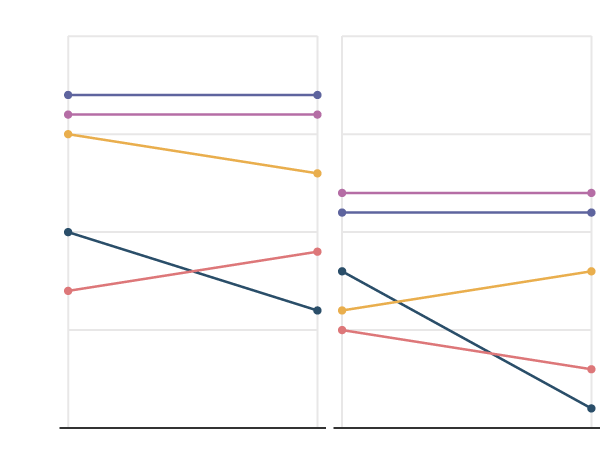
Fewer Black and Hispanic Graduates have a College Earnings Edge
Male
Female
90%
White
Share of bachelor’s degree graduates out-earning the high school median in their state, by race/ethnicity and sex
Asian
85
Multiracial
80
Hispanic
Black
75
Source: Authors' analysis of U.S. Census Bureau, American Community Survey (ACS) 2020–2024 5-year estimates, accessed via IPUMS USA (University of Minnesota), https://usa.ipums.org.
70
2010
2023
2010
2023
Note: Percents are rounded.
Male
Female
90%
White
85
Asian
Multiracial
80
Hispanic
Black
75
70
2010
2023
2010
2023
Male
Female
90%
White
85
Asian
Multiracial
80
Hispanic
Black
75
70
2010
2023
2010
2023
Male
Female
90%
White
85
Asian
Multiracial
80
Hispanic
Black
75
70
2010
2023
2010
2023
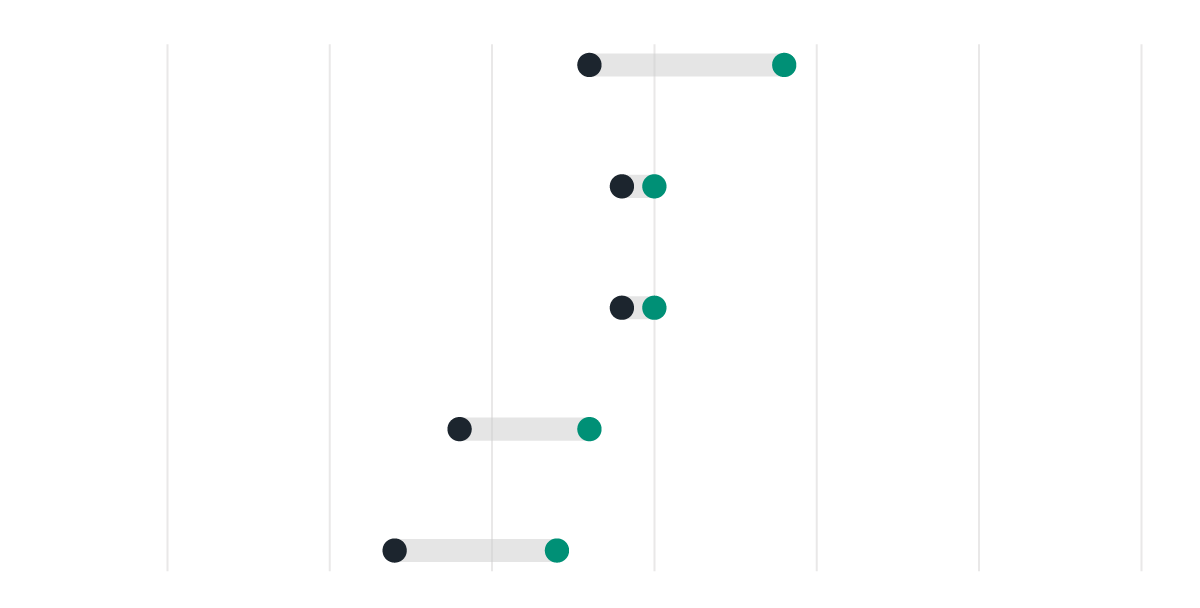
When matching the high school comparison group by sex, race, and ethnicity (rather than comparing to the overall state high school median), similar patterns emerge in terms of race and ethnicity: Black and Hispanic graduates still are the least likely to earn more than their high school counterparts. The pattern flips, however, for female graduates, who benefit more from a college degree than male graduates relative to their high school peers.

When Compared to Their Own Peers, Women Gain More From a College Degree Than Men
Male
Female
White
83%
89%
Share of bachelor’s degree graduates out-earning the median for high school completers of the same sex and race/ethnicity in their state
Asian
85
84
Multiracial
84
85
Hispanic
79
83
Note: Percents are rounded.
Black
77
82
Source: Authors' analysis of U.S. Census Bureau, American Community Survey (ACS) 2020–2024 5-year estimates, accessed via IPUMS USA (University of Minnesota), https://usa.ipums.org.
70
80
90
100%
Male
Female
White
83%
89%
Asian
85
84
Multiracial
84
85
Hispanic
79
83
Black
77
82
70
75
80
85
90
95
100%

Male
Female
White
83%
89%
Asian
85
84
Multiracial
84
85
Hispanic
79
83
Black
77
82
70
80
90
100%

Male
Female
White
83%
89%
Asian
85
84
Multiracial
84
85
Hispanic
79
83
Black
77
82
70
75
80
85
90
95
100%
The takeaway
Even in the most rural states, and for racial and ethnic groups whose earnings tend to be lower, the majority of college graduates see their degree pay off. But understanding the difference in the odds of that happening is important, both to have a clear picture of student experiences and to support efforts to ensure a more certain payoff. Looking at degree outcomes through how widespread the benefits are, in addition to how high they are on average, points to some important imperatives:
- Better data and transparency. We still know too little about which institutions and programs provide the best chance for economic mobility. More granular earnings data from federal sources could illuminate not only median earnings, but also the share of graduates that out-earn their high school peers. This type of data was once reported via the College Scorecard but has not been updated since 2021. At the state level, more specific data could be collected on where graduates live, allowing for a more nuanced comparison of earnings premiums compared to high school completers in the local geography. Once these data are collected, a vital additional step will be to provide clear upfront disclosures to students and families to inform their decisions before they commit to a program.
- Universal participation in supports that increase career success. Enduring disparities in earnings outcomes require a holistic assessment of what is leading to these differences — and what can be done to close the gaps. Universal participation in early career guidance and immersive paid work-based learning opportunities could help ensure more graduates walk across the stage not only with a diploma, but also a career plan and relevant experience to help them secure a good job.
- Cross-sector partnership. Geographic disparities highlight that positive ROI is not likely to be something that higher education institutions on their own can guarantee for students. Extending the economic benefits of higher education to all graduates will require partnership with state and local governments and the business community to attract and create good jobs locally and ensure that graduates are equipped to fill them.
Understanding which graduates are most likely to get a positive economic value from their education, and where that return is least certain, enables us to focus policy and resources on improving the odds for everyone while narrowing differences across groups and places. With a more comprehensive understanding of degree outcomes, we can target policy and resources where they are most needed, restore trust in higher education, and ensure that everyone, no matter where they start from, can reach their full potential.
1 Rodney J. Andrews, Scott A. Imberman, Michael F. Lovenheim, and Kevin M. Stange. “The Returns to College Major Choice: Average and Distributional Effects, Career Trajectories, and Earnings Variability.” (Cambridge, MA: National Bureau of Economic Research, August 2022, rev. March 2024).
2 Daniel Douglas and Paul Attewell. “The Relationship Between Work During College and Post College Earnings.” Frontiers in Sociology 4, Article 78 (2019): 1-13; Nichole Torpey-Saboe, Dave Clayton,and Elaine W. Leigh. “The Power of Work-Based Learning.” (Indianapolis: Strada Education Foundation, March 2022).
3 Enrico Moretti. The New Geography of Jobs. (New York: Houghton Mifflin Harcourt, 2012).
4 Enrico Moretti. “Estimating the Social Return to Higher Education: Evidence From Longitudinal and Repeated Cross-Sectional Data.” Journal of Econometrics 121, no. 1: 175–212; Moretti. The new geography of jobs.
Data tables
Suggested citation: Nichole Torpey-Saboe and Molly Cook Escobar, "Beyond the Average: The Uneven Geography of College ROI," (Indianapolis: Strada Education Foundation, July 2026).